


Why Stock Market Analysts Will be Wrong About 2017
Stock-Markets / Stock Market 2017 Feb 03, 2017 - 07:23 AM GMTBy: Clif_Droke

 We're already a month into New Year and there has been an ample amount of sentiment data to suggest that investors, both retail and institutional, aren't terribly enthusiastic on the stock market outlook for 2017. Granted that institutional analysts are still bullish, as per usual, but in the round table type opinion polls I've seen they've apparently lowered their expectations. Everyone seems to be preparing for a somewhat disappointing year based largely on the assumption that after eight years of a bull market, surely another major rally is out of the question.
The decennial rhythm we discussed in an earlier commentary argues against these diminished expectations. Indeed, seventh year of the decade tends to be one of unusual volatility for stock prices. While it's true crashes, corrections and panics are quite common in the seventh year (e.g. September 1987, October 1997, February/August 2007), the seventh year also sees a pronounced tendency for sustained rallies in the first seven months of the year. Accordingly, 2017 could be a year filled with tremendous opportunity for making money in the stock market - in both directions.
For 2017, the 10-year rhythm equates to 2007. As you recall, 2007 was a momentous year characterized at once by great volatility alternating between great fear and euphoria. It was the year that saw the last major stock market top and also the onset of the credit tsunami which overwhelmed the market the following year. If the decennial pattern holds true, 2017 should witness both a meaningful rally to new all-time highs as well as a decline of potentially major proportions. In short, it could turn out to be a big year for the bulls as well as the bears.
As for the idea that the bull market is getting "long in the tooth" and has therefore exhausted its upside potential, consider that the previous two years could well be characterized as a stealth bear market. The major large cap indices essentially went nowhere in 2015-2016 while the Russell Small Cap Index (RUT) experienced a 25% decline. That's a bear market by anyone's definition.
Retail investors have also been quite pessimistic since 2015 in the overall scheme of things. From the start of 2015 up until the election, more than $200 billion was pulled out of U.S. equity funds and ETFs, while a bit more than that was funneled into bond funds and ETFs. That two-year stretch of risk aversion, however, is apparently ending as investors have gradually embraced more risk tolerance since the election. Since the election nearly $46 billion has flowed into U.S. equity funds, while nearly $3 billion has left bond funds, according to money flow statistics.
The evidence strongly suggests that the past two years served the purpose of clearing out the excesses generated by the long-term bull market which began in 2009. In other words, the market is rested and ready to resume its potential as we head further into 2017.
Another concern among investors is that the rise in interest rates since last year could stifle the stock market's upside potential. While it's true that sustained periods or rising Treasury yields have often proved a hindrance to higher stock prices, there is an exception to that rule. According to LPL Research, there have been 11 periods of rising interest rates (at least a 1% rise in the 10-year Treasury note) since 1996, each lasting an average of six months. During those times, the S&P 500 rose an average of 5.44%, thus proving that in the early stages of rising interest rates stocks and yields often rise simultaneously.
We're at a point in the long-wave credit cycle where interest rates are ready to rise after being depressed for years. According to K-Wave theory, after the 60-year economic cycle bottomed in 2014 we should see a gradual increase in rates as the economy recovers its former vigor. Of course this process will take a long time to complete - possibly decades - but we're likely at a point in the newly formed 60-year cycle where even a temporarily sharp run-up in rates won't damage the economy or even necessarily hinder the stock market. In fact, rising rates at this point indicates increasing demand for credit and a corresponding improvement in the economy.
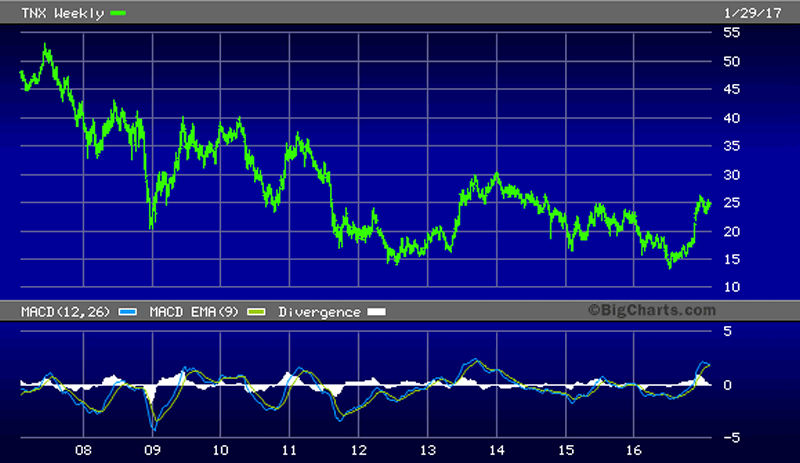
Following is a 10-year chart of the 10-year Treasury Yield Index (TNX). The double-bottom in the interest rate is clearly visible between the years 2012 and 2016. I believe this marks the long-term low in interest rates for the previous long-term cycle.
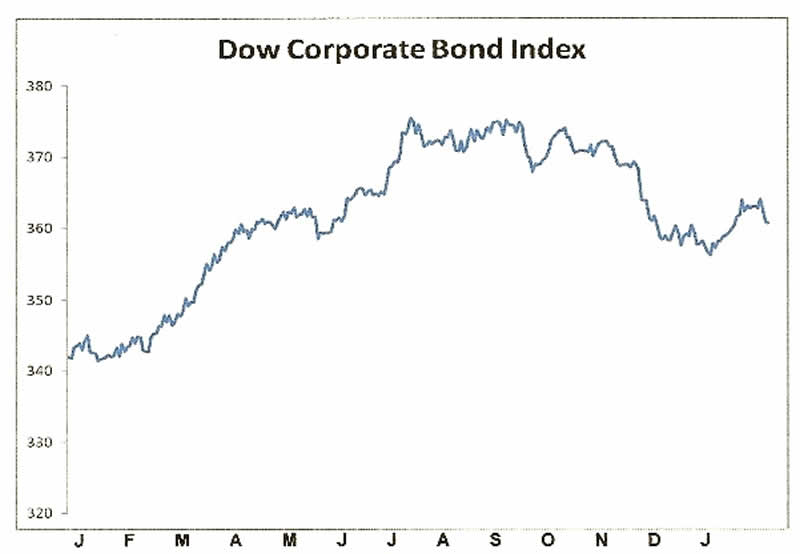
As long as rates don't rise too high, too fast it's very possible that stock prices will rise along with Treasury yields without much interference along the way. An added bonus to the rally in T-bond yields is that bond prices are now in a downward trend. This should serve to discourage investors who piled heavily into the bond market in the last few years. It should also cause them to look more closely at stocks as a long-term investment once again, especially as painful memories from the 2008 crash gradually wear off. The underperformance of corporate debt vis-à-vis equities should also encourage investors to take a second look at the stock market. Below is the 1-year graph of the Dow Jones Corporate Bond Index.
The bottom line is that 2017 should see an increase in business activity across the board as the U.S. returns to a normal business cycle after being artificially suppressed by the actions of central banks for years. Moreover, the decennial rhythm suggests that except for a period of potential weakness in the August-October time frame, year 2017 will likely prove to be a memorable one especially from the standpoint of the upside potential in both the equity market and the U.S. economy.
Mastering Moving Averages
The moving average is one of the most versatile of all trading tools and should be a part of every investor's arsenal. Far more than a simple trend line, it's also a dynamic momentum indicator as well as a means of identifying support and resistance across variable time frames. It can also be used in place of an overbought/oversold oscillator when used in relationship to the price of the stock or ETF you're trading in.
In my latest book, Mastering Moving Averages, I remove the mystique behind stock and ETF trading and reveal a simple and reliable system that allows retail traders to profit from both up and down moves in the market. The trading techniques discussed in the book have been carefully calibrated to match today's fast-moving and sometimes volatile market environment. If you're interested in moving average trading techniques, you'll want to read this book.
Order today and receive an autographed copy along with a copy of the book, The Best Strategies for Momentum Traders. Your order also includes a FREE 1-month trial subscription to the Momentum Strategies Report newsletter: http://www.clifdroke.com/books/masteringma.html
By Clif Droke
www.clifdroke.com
Clif Droke is the editor of the daily Gold & Silver Stock Report. Published daily since 2002, the report provides forecasts and analysis of the leading gold, silver, uranium and energy stocks from a short-term technical standpoint. He is also the author of numerous books, including 'How to Read Chart Patterns for Greater Profits.' For more information visit www.clifdroke.com
Clif Droke Archive |
© 2005-2022 http://www.MarketOracle.co.uk - The Market Oracle is a FREE Daily Financial Markets Analysis & Forecasting online publication.