


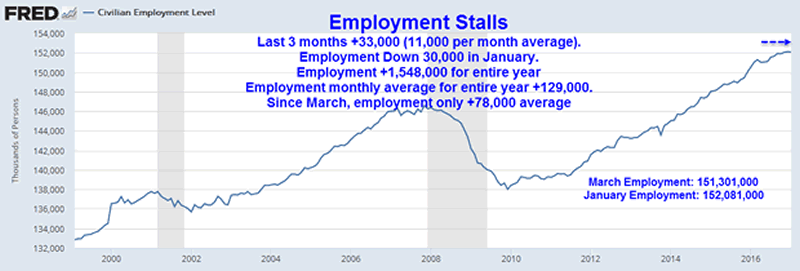
Shocking Fact in Today's US Jobs Report: Employment Stalls
Economics / Employment Feb 03, 2017 - 05:00 PM GMTBy: Mike_Shedlock

 Initial Reaction
Today's employment report shows a robust increase of 227,000 jobs. The good news stops there. The rest of the report was horrific.
The big news is in employment where the three-month trend worsened.
In the last three months, employment has only risen by a grand total of 33,000. Employment in January declined by 30,000. For the entire year, employment rose by only 1,548,000. The average increase from a year ago is only 129,000 per month.
These trends have now gone on long enough they should be ignored. But they are.
Instead, media is gaga over the beat-the-street headline number of +227,000 jobs.
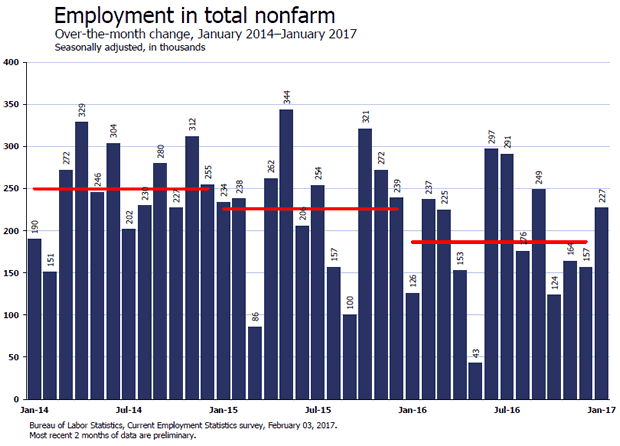
Last month the BLS revised revised November employment to 204,000 from 178,000. This month the BLS revised November from 204,000 to 164,000. In the past two months the BLS revised October lower each month, from 161,000 to 142,000 to 135,000. The BLS revised October a third time. October now sits at 124,000. This month the BLS revised September up from 208,000 to 249,000.
Let's dive into the details in the BLS Employment Situation Summary, unofficially called the Jobs Report.
BLS Jobs Statistics at a Glance
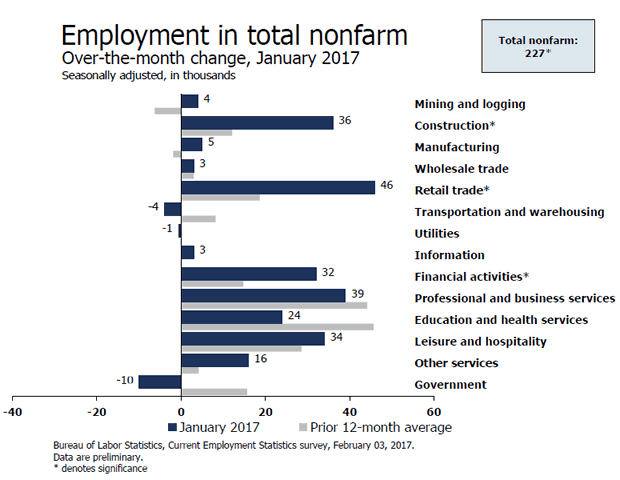
- Nonfarm Payroll: +227,000 - Establishment Survey
- Employment: -30,000 - Household Survey
- Unemployment: +106,000 - Household Survey
- Involuntary Part-Time Work: +242,000 - Household Survey
- Voluntary Part-Time Work: +236,000 - Household Survey
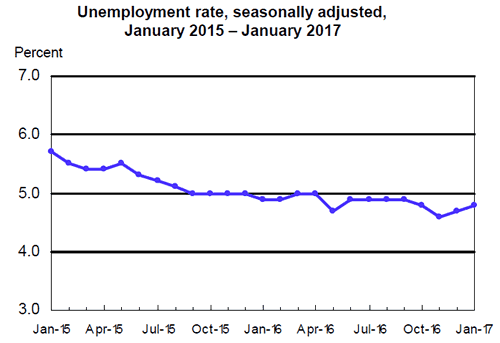
- Baseline Unemployment Rate: +0.1 to 4.8% - Household Survey
- U-6 unemployment: +0.2 to 9.4% - Household Survey
- Civilian Non-institutional Population: -660,000
- Civilian Labor Force: +76,000 - Household Survey
- Not in Labor Force: +264,000 - Household Survey
- Participation Rate: +0.2 to 62.9 - Household Survey
Employment Report Statement
Total nonfarm payroll employment increased by 227,000 in January, and the unemployment rate was little changed at 4.8 percent. Job gains occurred in retail trade, construction, and financial activities.
Unemployment Rate - Seasonally Adjusted
Nonfarm Employment Change from Previous Month
Nonfarm Employment Change from Previous Month by Job Type
Hours and Wages
Average weekly hours of all private employees was steady at 34.3 hours. Average weekly hours of all private service-providing employees was steady at 33.3 hours. Average weekly hours of manufacturers rose 0.1 hours to 40.8 hours.
Average hourly earnings of private workers rose $0.04 to $21.84. Average hourly earnings of private service-providing employees rose $0.04 to $21.63. Average hourly earnings of manufacturers rose $0.01 to $20.65.
For discussion of income distribution, please see What's "Really" Behind Gross Inequalities In Income Distribution?
Birth Death Model
Starting January 2014, I dropped the Birth/Death Model charts from this report. For those who follow the numbers, I retain this caution: Do not subtract the reported Birth-Death number from the reported headline number. That approach is statistically invalid. Should anything interesting arise in the Birth/Death numbers, I will add the charts back.
Table 15 BLS Alternate Measures of Unemployment
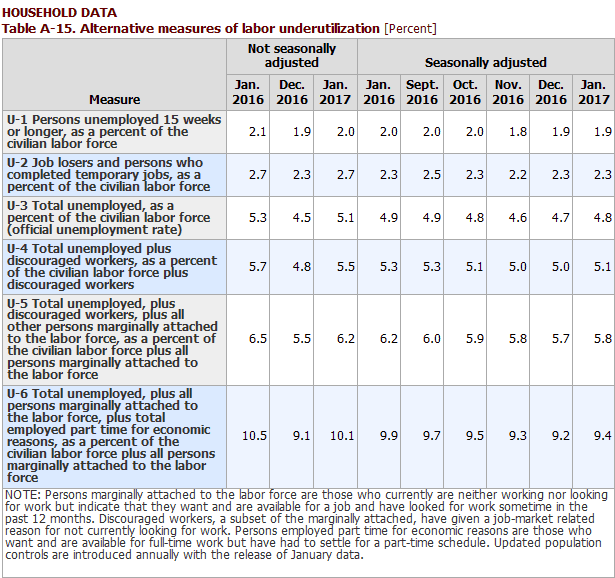
Table A-15 is where one can find a better approximation of what the unemployment rate really is.
Notice I said "better" approximation not to be confused with "good" approximation.
The official unemployment rate is 4.8%. However, if you start counting all the people who want a job but gave up, all the people with part-time jobs that want a full-time job, all the people who dropped off the unemployment rolls because their unemployment benefits ran out, etc., you get a closer picture of what the unemployment rate is. That number is in the last row labeled U-6.
U-6 is much higher at 9.4%. Both numbers would be way higher still, were it not for millions dropping out of the labor force over the past few years.
Some of those dropping out of the labor force retired because they wanted to retire. The rest is disability fraud, forced retirement, discouraged workers, and kids moving back home because they cannot find a job.
Strength is Relative
It's important to put the jobs numbers into proper perspective.
- In the household survey, if you work as little as 1 hour a week, even selling trinkets on EBay, you are considered employed.
- In the household survey, if you work three part-time jobs, 12 hours each, the BLS considers you a full-time employee.
- In the payroll survey, three part-time jobs count as three jobs. The BLS attempts to factor this in, but they do not weed out duplicate Social Security numbers. The potential for double-counting jobs in the payroll survey is large.
Household Survey vs. Payroll Survey
The payroll survey (sometimes called the establishment survey) is the headline jobs number, generally released the first Friday of every month. It is based on employer reporting.
The household survey is a phone survey conducted by the BLS. It measures unemployment and many other factors.
If you work one hour, you are employed. If you don't have a job and fail to look for one, you are not considered unemployed, rather, you drop out of the labor force.
Looking for jobs on Monster does not count as "looking for a job". You need an actual interview or send out a resume.
These distortions artificially lower the unemployment rate, artificially boost full-time employment, and artificially increase the payroll jobs report every month.
Final Thoughts
This report was shockingly bad. Employment growth was +129,000 on average from a year ago, +79,000 per month since March, and only +11,000 per month for the last three months.
Employment has stalled.
By Mike "Mish" Shedlock http://globaleconomicanalysis.blogspot.com
Click Here To Scroll Thru My Recent Post List
Mike Shedlock / Mish is a registered investment advisor representative for SitkaPacific Capital Management . Sitka Pacific is an asset management firm whose goal is strong performance and low volatility, regardless of market direction. Visit Sitka Pacific's Account Management Page to learn more about wealth management and capital preservation strategies of Sitka Pacific.
I do weekly podcasts every Thursday on HoweStreet and a brief 7 minute segment on Saturday on CKNW AM 980 in Vancouver. When not writing about stocks or the economy I spends a great deal of time on photography and in the garden. I have over 80 magazine and book cover credits. Some of my Wisconsin and gardening images can be seen at MichaelShedlock.com .
© 2016 Mike Shedlock, All Rights Reserved.
Disclaimer: The above is a matter of opinion provided for general information purposes only and is not intended as investment advice. Information and analysis above are derived from sources and utilising methods believed to be reliable, but we cannot accept responsibility for any losses you may incur as a result of this analysis. Individuals should consult with their personal financial advisors.
Mike Shedlock Archive |
© 2005-2022 http://www.MarketOracle.co.uk - The Market Oracle is a FREE Daily Financial Markets Analysis & Forecasting online publication.