


Stock Market VIX Cycles Set to Explode in March/April 2017
Stock-Markets / Volatility Feb 09, 2017 - 06:55 PM GMTBy: Chris_Vermeulen

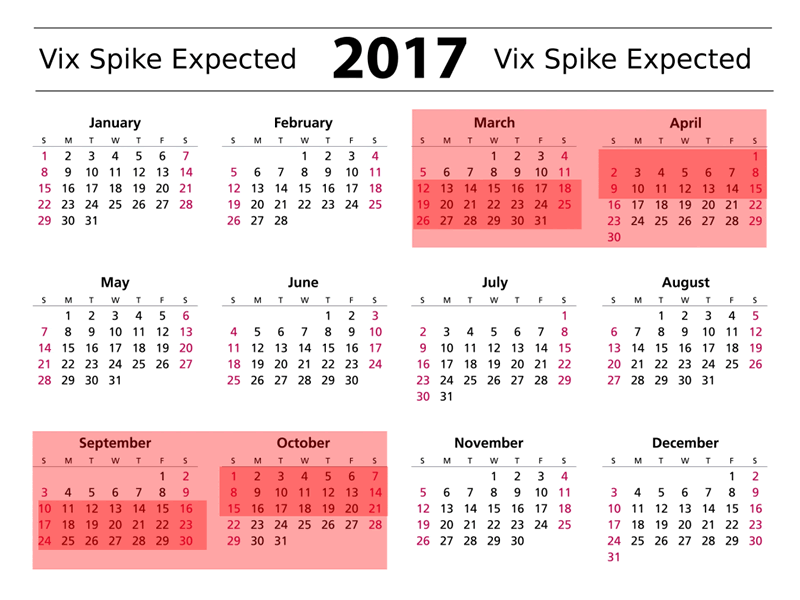
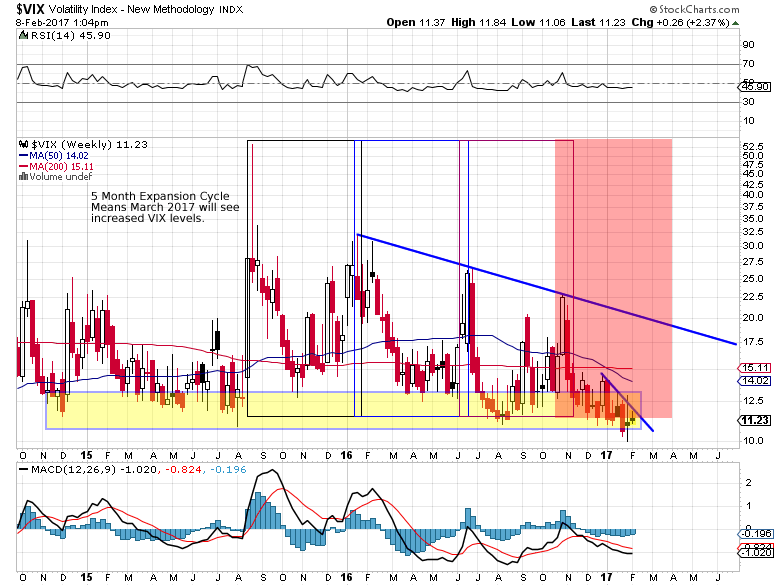
 My recent analysis of the markets has shown what I believe to be an explosion in market volatility set to starting happening between February 21, 2017 and March 30, 2017. The historical VIX cycles have been running about 18~22 week intervals for expansion and extreme volatility levels. The period August 2015 to January 2016 represented roughly 5 months. The period between January 2016 to June 2016 represented roughly 5 months. The period between June 2016 to Early November 2016 represented roughly 5 months (just a little short of 5 months in reality).
The period between November 2016 to the next volatility expansion phase, if this cycle continues, should be March/April 2107 at a target date range.
How will this relate to the US major markets? I currently believe the recent “melt-up” will stay in place until we have some catalyst that will change the direction of the markets. In other words, the path of least resistance in the US major markets is upward right now – at least till something changes that direction/sentiment. The VIX cycles may be related to some catalyst event or external foreign market event that could change the major market directions – nut only time will tell.
Currently, on the below DIA chart, I can state that my estimates for upside resistance is 210~212 based on historical price action. The reason I believe these levels will become upside target objectives is based on my understanding of price rotation, expansion and contraction as well as Fibonacci ratios. The actual number that I believe will be resistance is 211.63 and I believe this level will be reached in March 2017 or early April 2017.
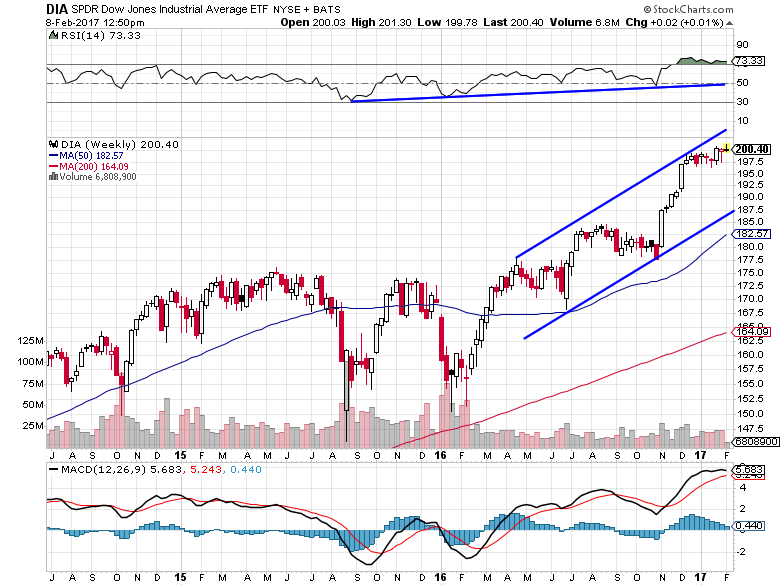
Once this critical resistance level is reached in the DIA, then all bets are off in terms of the price retracement/rotation that may occur. Given historical price rotation as examples, I would estimate that the DIA could retrace a minimum of 6~8% ($13 to $17). A moderate price rotation would equate to a move of 10%~13.5% ($21 to $28). Beyond these expected levels of support, all bets are off in terms of downside potential. The closest major downside support levels are $178.25, $170.30 and $154.35 – these levels represent a greater than 15% total price retracement and would put us dangerously close to “Bear Market Territory”.
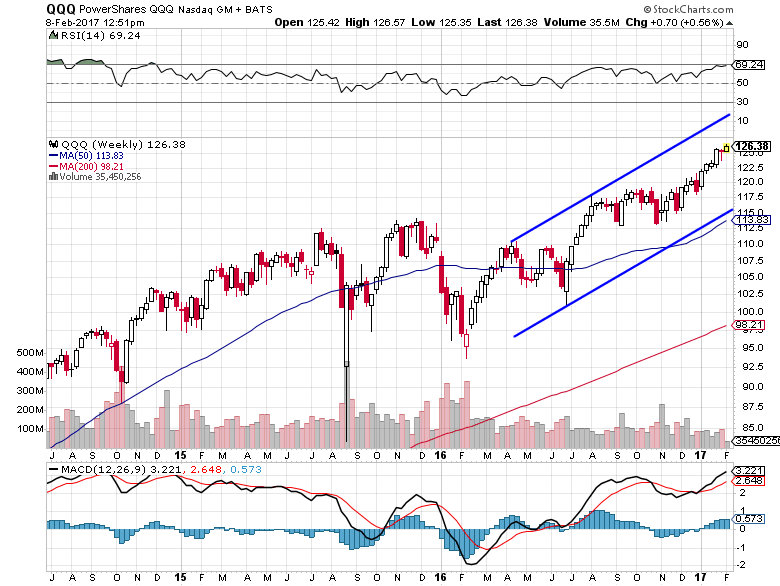
Of course, if the VIX cycles persist as I suspect, a massive increase in volatility will drive other markets into further trending or price rotation as well. The tech heavy NASDAQ (QQQ) has been mirroring the DIA and my projected top level is 128.15. Currently, the QQQ is at $126.54 – only $1.65 (or 1.33%) away from my expected peak level. After these peaks have been reached, I expect the major market to take pause and attempt to resume trending as we move closer to the volatility cycle period I suspect is driving the VIX (March/April 2017). It is because of this that I’m issuing this warning to my members to be cautious of extended risk or exposed positions as we near the end of February 2017. I believe the old term, “Beware the ides of March”, may be a harsh reality this year.
As I continue my extended analysis of the US major markets and commodity markets in relation to these VIX cycles, I will post “Part 2” of this article within a day or so. I wanted to get this out to all my members and associates so they were brought aware of the fact that the markets are beginning a phase of volatility expansion that should not end till near April 1st, 2017.
In short, what does all this mean? Well, it means now is not the time to be adding new long equity position for long term growth. Going forward, its going to be all about active trading and focusing on my Momentum Reversal Method (MRM) and trading just the hot stocks and sectors for quick oversized gains.
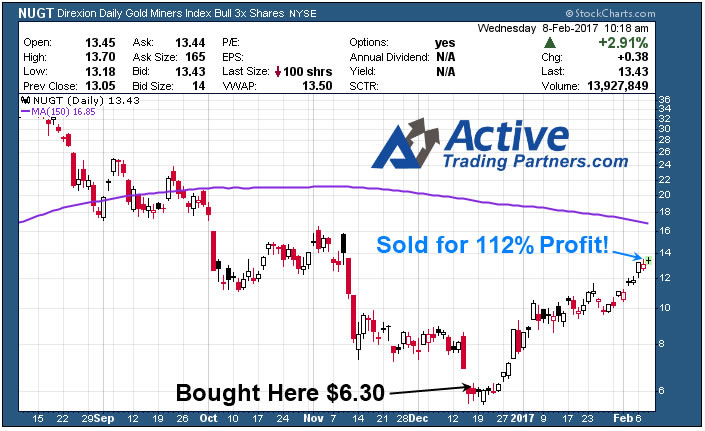
On Feb 8th, myself and subscribers closed out our NUGT trade for a 112% profit that we entered December 16th.
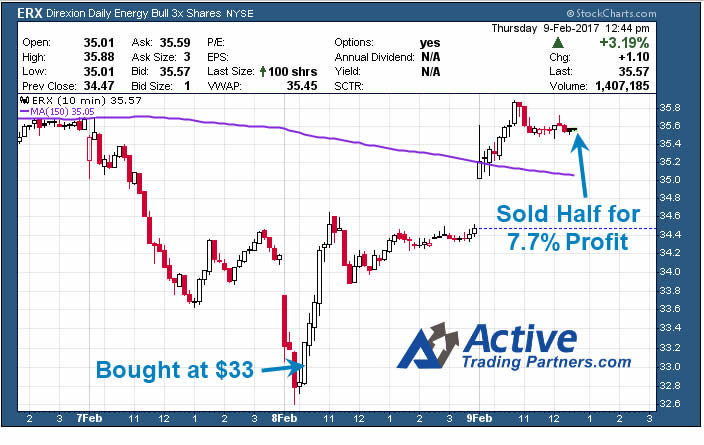
This week we got long ERX at $33, and sold half the position 24 hours later for another quick 7.7% profit and there is still a lot of room for bigger gains there.
So, if you are looking for a simple and highly accurate pulse on the market along with timely swing trades I urge you to join my newsletter at www.ActiveTradingPartners.com – STAY TUNED FOR PART II…
Chris Vermeulen
Chris Vermeulen is Founder of the popular trading site TheGoldAndOilGuy.com. There he shares his highly successful, low-risk trading method. For 7 years Chris has been a leader in teaching others to skillfully trade in gold, oil, and silver in both bull and bear markets. Subscribers to his service depend on Chris' uniquely consistent investment opportunities that carry exceptionally low risk and high return.
Disclaimer: Nothing in this report should be construed as a solicitation to buy or sell any securities mentioned. Technical Traders Ltd., its owners and the author of this report are not registered broker-dealers or financial advisors. Before investing in any securities, you should consult with your financial advisor and a registered broker-dealer. Never make an investment based solely on what you read in an online or printed report, including this report, especially if the investment involves a small, thinly-traded company that isn’t well known. Technical Traders Ltd. and the author of this report has been paid by Cardiff Energy Corp. In addition, the author owns shares of Cardiff Energy Corp. and would also benefit from volume and price appreciation of its stock. The information provided here within should not be construed as a financial analysis but rather as an advertisement. The author’s views and opinions regarding the companies featured in reports are his own views and are based on information that he has researched independently and has received, which the author assumes to be reliable. Technical Traders Ltd. and the author of this report do not guarantee the accuracy, completeness, or usefulness of any content of this report, nor its fitness for any particular purpose. Lastly, the author does not guarantee that any of the companies mentioned in the reports will perform as expected, and any comparisons made to other companies may not be valid or come into effect.
Chris Vermeulen Archive |
© 2005-2022 http://www.MarketOracle.co.uk - The Market Oracle is a FREE Daily Financial Markets Analysis & Forecasting online publication.