


SPX Stocks Bull Market Continues to make New Highs
Stock-Markets / Stock Market 2017 Feb 18, 2017 - 03:26 PM GMTBy: Tony_Caldaro

 The market started the week at SPX 2316. After a gap up opening on Monday the market traded to SPX 2351 by Wednesday. Then after a pullback to SPX 2339 on Thursday, the market rallied to end the week at SPX 2351. For the week the SPX/DOW gained 1.65%, and the NDX/NAZ gained 1.85%. Economic reports for the week were mostly higher. On the downtick: capacity utilization, industrial production, the WLEI, the Q1 GDP estimate, the NAHB, plus weekly claims rose. On the uptick: the CPI/PPI, NY/Philly FED, retail sales, business inventories, housing starts, building permits and leading indicators. Next week’s reports will be highlighted by the FOMC minutes, consumer sentiment and more housing reports. Best to your 3-day weekend and week!
LONG TERM: uptrend
Our long term count remains unchanged. A Primary wave III bull market began at the February, 2016 low of SPX 1810, and it celebrated its one-year anniversary this week. From that low we have labeled Intermediate waves i and ii at SPX 2111 and SPX 1992 respectively. Then labeled Minor waves 1 and 2 at SPX 2194 and SPX 2084 respectively. Since that last low it appears Minor wave 3, of Intermediate iii, has been underway.
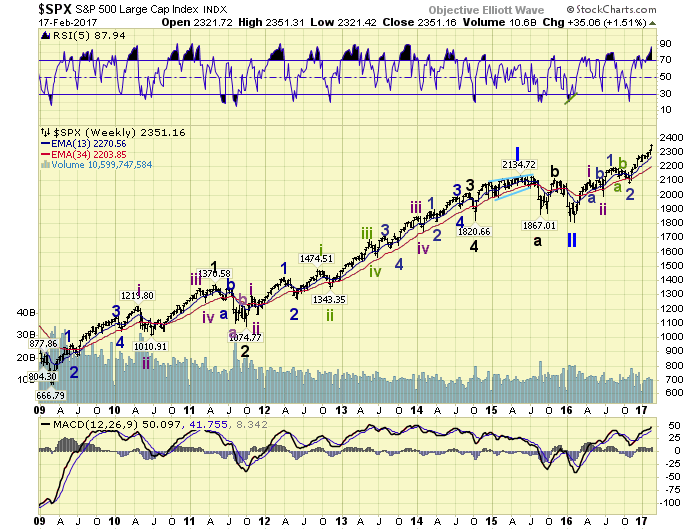
Last weekend we noted. If the OEW 2321 and 2336 pivots offered resistance, like the multi-week resistance offered by the OEW 2270 and 2286 pivots, this three-month uptrend could top in this range. And the OEW 2336 pivot was the last possible level for any probable long term top. On Monday the market cleared the OEW 2321 pivot, and the OEW 2336 pivot was cleared on Wednesday. They offered hardly any resistance at all. In fact, after the OEW 2336 pivot was cleared it acted as support on two short term pullbacks. All potential long term bearish counts have been eliminated.
MEDIUM TERM: uptrend
This Minor wave 3 uptrend began three months ago, just before the election. Off that Minor 2 SPX 2084 low, we counted 5 waves up to SPX 2278. Then after a pullback to SPX 2234 we labeled those levels with Minute waves i and ii. Since SPX 2234 the market has been rising in Minute wave iii.
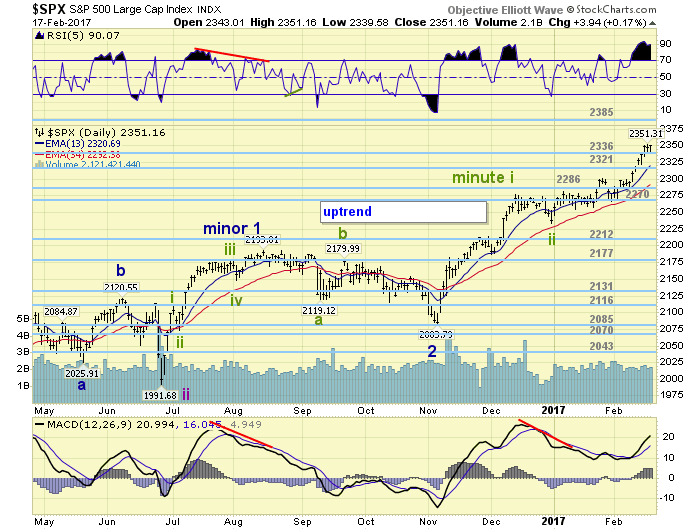
When this uptrend began in early-November from SPX 2084, we estimated it would rise about 300-points into the SPX 2380’s. This week it entered the SPX 2350’s. We can count 5 waves up for Minute iii, but the first 4 waves are overlapping. This suggests Minute iii is subdividing further than 5 waves, possibly 9 waves. The DOW has a cleaner count, suggesting it is in the third wave of Minute iii. We’ll continue to compare these two indices, while this uptrend continues to unfold, as we have since this bull market began. Medium term support is at the 2336 and 2321 pivots, with resistance at the 2385 and 2411 pivots.
SHORT TERM
As noted above we see five waves completed, with the first four waves overlapping, during Minute wave iii: 2282-2257-2301-2267-2351. This suggests Minute iii is subdividing into at least 9 waves. With the daily/weekly RSI quite overbought the sixth wave, a pullback of about 30 points, can occur at any time. But this should only be a pause in this extending uptrend.
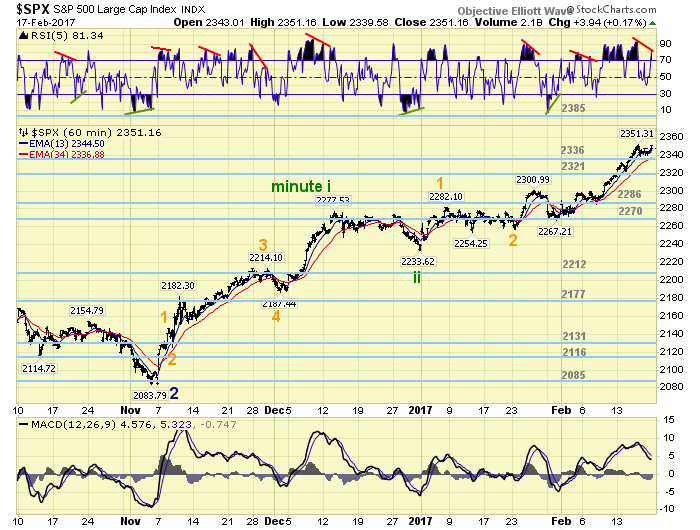
Since third waves are usually at least equal to first waves, this would give us a general upside target in the SPX 2420’s just for Minute wave iii. And this uptrend may not even end there, as there are still Minute waves iv and v to follow. For now, we’ll just take it one pivot at a time and monitor the short term waves. Short term support is at the 2336 and 2321 pivots, with resistance at SPX 2351 and the 2385 pivot. Short term momentum ended the week with a negative divergence. In strong uptrends it is usually best to first wait for at least a 5-point reversal at a negative divergence. Best to your trading come Tuesday.
FOREIGN MARKETS
Asian markets were all higher and gained a net of 0.8% on the week.
European markets were also all higher and gained 0.8% as well.
The DJ World index gained 1.0%, and the NYSE index gained 1.2%.
COMMODITIES
Bonds are back in a downtrend and lost 0.1% on the week.
Crude is trying to establish an uptrend but lost 0.2%.
Gold is in an uptrend and gained 0.3%.
The USD is still in a downtrend but gained 0.1%.
NEXT WEEK
Monday: holiday. Wednesday: existing home sales and the FOMC minutes. Thursday: weekly jobless claims and the FHFA housing index. Friday: consumer sentiment and new home sales. Enjoy the extended weekend!
CHARTS: http://stockcharts.com/public/1269446/tenpp
After about 40 years of investing in the markets one learns that the markets are constantly changing, not only in price, but in what drives the markets. In the 1960s, the Nifty Fifty were the leaders of the stock market. In the 1970s, stock selection using Technical Analysis was important, as the market stayed with a trading range for the entire decade. In the 1980s, the market finally broke out of it doldrums, as the DOW broke through 1100 in 1982, and launched the greatest bull market on record.
Sharing is an important aspect of a life. Over 100 people have joined our group, from all walks of life, covering twenty three countries across the globe. It's been the most fun I have ever had in the market. Sharing uncommon knowledge, with investors. In hope of aiding them in finding their financial independence.
Copyright © 2017 Tony Caldaro - All Rights Reserved Disclaimer: The above is a matter of opinion provided for general information purposes only and is not intended as investment advice. Information and analysis above are derived from sources and utilising methods believed to be reliable, but we cannot accept responsibility for any losses you may incur as a result of this analysis. Individuals should consult with their personal financial advisors.
Tony Caldaro Archive |
© 2005-2022 http://www.MarketOracle.co.uk - The Market Oracle is a FREE Daily Financial Markets Analysis & Forecasting online publication.