


Technical Update for Crude Oil: Brent and WTI
Commodities / Crude Oil Mar 12, 2017 - 05:34 PM GMTBy: MarketsToday

 Highlights: Brent Crude
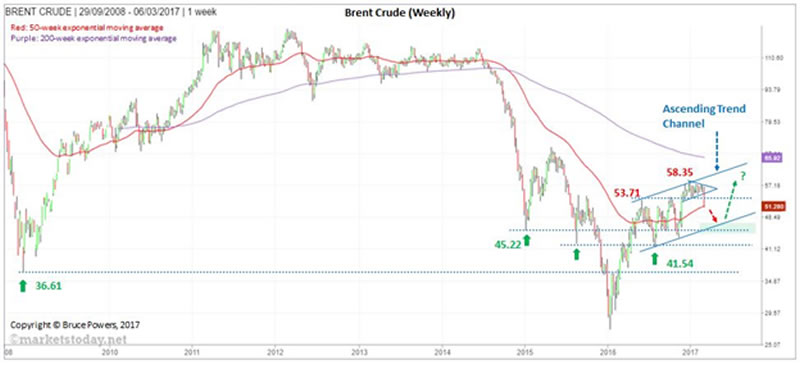
- Brent has been progressing upwards in an ascending trend channel for a number of months
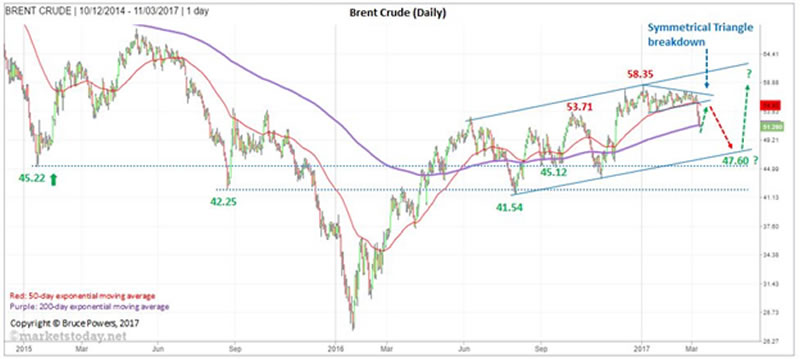
- Last week it broke down sharply from a tight symmetrical triangle or pennant pattern and through support of the 50-day exponential moving average (ema) before finding support around the 50-week ema and the 200-day ema. The low for the week was 51.18.
- Brent is now likely to either:
- bounce from here back up towards the breakdown level around 55.00 to test it as resistance, before turning back down, or
- relatively quickly continue the descent to lower support levels
- Further weakness is likely to eventually see Brent hit at least the lower channel line, which looks to be around 47.60 at this point.
- If it continues to progress within the channel then another touch of the upper line is possible eventually once the current correction is complete.
- At this point resistance of the upper line looks like it would be around the 200-week ema (now at 65.92).
Highlights: WTI Crude
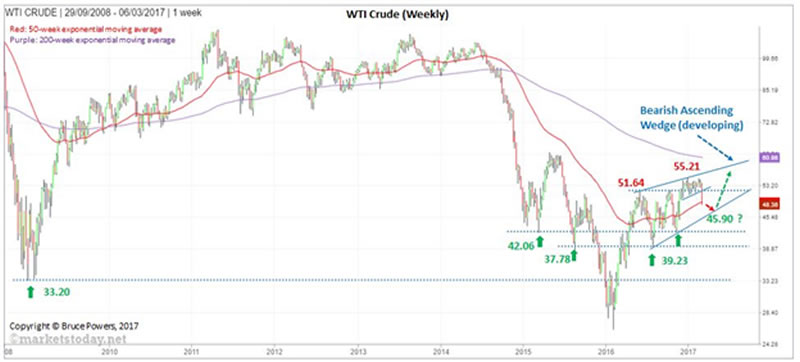
- WTI has formed a potentially bearish ascending wedge over recent months
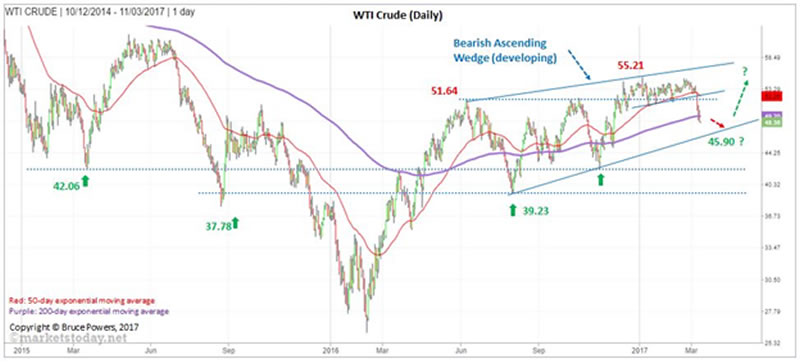
- Last week it broke down sharply from a tight short-term consolidation pattern formed around resistance of the wedge, and dropped below support of the 50-day ema.
- Support so far is at the low for the week of 48.36. That’s just below both the 50-week ema and the 200-day ema but still close enough where the area of last week’s low may hold and lead to a bounce.
- Brent is now likely to either:
- bounce from here back up towards the breakdown level around 52.25 to test it as resistance, before turning back down, or
- relatively quickly continue the descent
- Further weakness is likely to eventually see WTI hit at least the lower trend line of the ascending wedge. At this point it looks like that would occur around the 45.90 price area.
- If WTI continues to progress within the wedge then another touch of the upper line is possible once the current correction is complete.
- Given the current structure of the wedge it looks like there could be more time needed for the wedge to fully form before it breaks down, if it is to do so. This is supportive of another move higher eventually.
- As with Brent, it looks like the 200-day ema will be close to the upper wedge line by the time WTI gets there.
Note: Keep in mind that price/chart patterns can and do fail, and they can also evolve into different patterns.
Bruce Powers, CMT Chief Technical Analyst http://www.marketstoday.net/
© 2017 Copyright Bruce Powers- All Rights Reserved
Disclaimer: The above is a matter of opinion provided for general information purposes only and is not intended as investment advice. Information and analysis above are derived from sources and utilising methods believed to be reliable, but we cannot accept responsibility for any losses you may incur as a result of this analysis. Individuals should consult with their personal financial advisors.
© 2005-2022 http://www.MarketOracle.co.uk - The Market Oracle is a FREE Daily Financial Markets Analysis & Forecasting online publication.