


Why Now Gold and Silver Precious Metals?
Commodities / Gold and Silver 2017 Apr 22, 2017 - 01:53 PM GMTBy: Richard_Mills

 John Exter was an American economist and a member of the Board of Governors of the United States Federal Reserve System.
Exter is known for creating Exter's Pyramid - useful for visualizing the organization of asset classes in terms of risk and size.
When the credit system is expanding most money flows to the top of the pyramid - the increasingly speculative and illiquid investments. When the credit system comes under pressure and debt cannot be repaid, the items at the top of the pyramid get sold and money flows towards the bottom.
"In order to make use of it though, we must first make the distinction between real wealth and claims on wealth. Real wealth is represented by actual items that people want or need. This can be food, land, natural resources, buildings, factories etc. Financial assets, shown as layers in the pyramid, represent claims on real wealth. In a fully developed financial system, in good perceived standing, there is a high ratio of claims on wealth to actual underlying real wealth. In this environment the average buying power of the financial assets is lower. This can best be observed by looking at the purchasing power at the bottom of the pyramid. Gold is at a minimum here. It is competing with all of the other claims on wealth for a relatively constant amount of underlying real assets.
According to Exter's theory of money, when economies get into trouble through the accumulation of too much debt, the levels of the pyramid disappear in order from highest to lowest. As the pyramid contracts downward, the remaining layers represent a proportionally higher claim on the real underlying wealth. In other words their value increases. Using gold as our reference point, it's relative purchasing power increases as the pyramid contracts. Gold finds itself in a secular bull market." ~ Trace Mayer, The Paper Empire
The Debt Pile
In January of 2017 the Institute for International Finance (IIF) reported global debt levels – total world debt - rose to more than 325 percent of the world's annual gross domestic product in 2016. Global debt had risen more than $11 trillion in the first nine months of 2016 to more than $217 trillion with general government debt accounting for almost half of the increase.
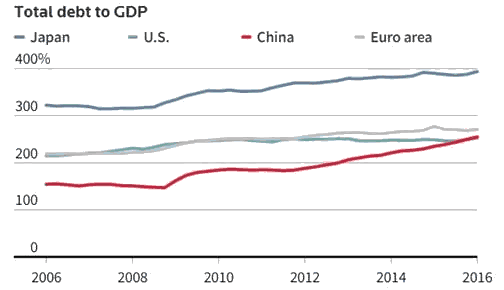
Reuters
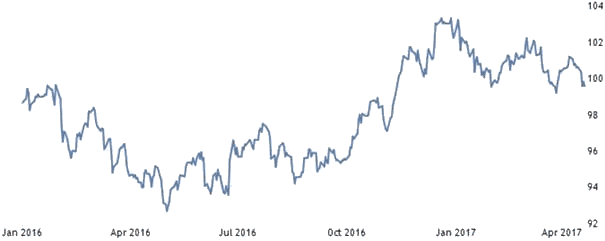
U.S. Dollar
The IIF said "an environment of subdued growth and still-weak corporate profitability, a stronger (U.S. dollar), rising sovereign bond yields, higher hedging costs, and deterioration in corporate creditworthiness presented challenges for borrowers...a shift toward more protectionist policies could also weigh on global financial flows. Moreover, given the importance of the City of London in debt issuance and derivatives (particularly for European and EM firms), ongoing uncertainties surrounding the timing and nature of the Brexit process could pose additional risks including a higher cost of borrowing and higher hedging costs."
Moody's Investors Service Inc. reports that US$3.9 trillion worth of global private debt (the combination of business debt and household debt) was issued in 2016, a record high.
For the full year 2016, total U.S. household debt rose by $460 billion to $12.58 trillion, the biggest annual increase in a decade. Total U.S. household debt is $99 billion (0.8%), shy of its all-time peak of $12.7 trillion set in Q3 2008 just as the financial crisis was starting. When measured as a percentage of GDP, total household borrowing today is 67% of nominal gross domestic product, compared with 85% in 2008.
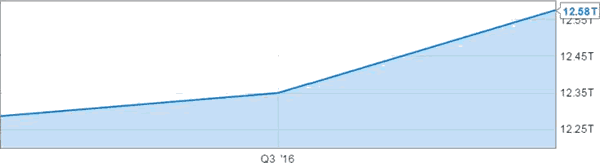
Business Insider 1 year chart showing explosion in household debt
"The only way to keep payments current is with a low rate environment. There is no choice. So central banks will do everything they can to print this debt into oblivion. In many ways this is a reason that we have seen a rush into... anything that isn't just a bunch of 1s and 0s on a central bank computer easily changed by the whims of politicians and those connected to them." ~ MyBudget360
Up to 85 per cent of borrowing is being used to finance existing corporate assets, real estate or unsecured personal finance. Borrowers are more often than not financing pre-existing assets thinking price rises are to be the source of repayment.
"Private debt is a beneficial and essential part of any economy. However, as it increases, it can bring two problems. The first is dramatic. Very rapid or "runaway" private debt growth often brings financial crises. Runaway private debt growth brought the 2008 crisis in the United States, the 1991 crisis in Japan, and the 1997 crisis across Asia, to name just three." Richard Vague, The Private Debt Crisis
Winds of war
"I spent many years in the trenches of the first Cold War, and I don't want to die in the trenches of the second. We are back to 1983, and I don't enjoy being thirty-four years younger in this way. It's frightening." Trump, Putin, and the New Cold War
"North Korea's UN deputy representative, Kim In Ryong, on Monday unleashed at a hastily called UN press conference a torrent of threats, war scenarios and rhetoric aimed at the United States." North Korean envoy at UN warns of nuclear war possibility
"Think of two significant trend lines in the world today. One is the increasing ambition and activism of the two great revisionist powers, Russia and China. The other is the declining confidence, capacity, and will of the democratic world, and especially of the United States, to maintain the dominant position it has held in the international system since 1945. As those two lines move closer, as the declining will and capacity of the United States and its allies to maintain the present world order meet the increasing desire and capacity of the revisionist powers to change it, we will reach the moment at which the existing order collapses and the world descends into a phase of brutal anarchy, as it has three times in the past two centuries. The cost of that descent, in lives and treasure, in lost freedoms and lost hope, will be staggering." ~ Backing Into World war III
"As much of the world focuses on the growing hostilities between the United States and Russia as well as the war in Syria heading into 2017, it would be easy to forget about an ongoing conflict between two nuclear-armed neighbors." ~ India-Pakistan War In 2017?
The Council on Foreign Relations' (CFR) ninth annual Preventive Priorities Survey identified seven top potential flashpoints for the United States in 2017.
North Korea warns of 'super-mighty preemptive strike' as U.S. plans next move
"Foreign Minister Mevlüt Cavusoglu, on March 16, commented on the general elections in the Netherlands and the election victory of Prime Minister Mark Rutte's liberal VVD party, warning that Europe will soon be the site of religious wars." ~ Turkish FM Warns "Religious Wars" Will Soon Start in Europe
Here is an older but excellent, and still very much relevant, read from the New York Times 'This Is a Religious War.'
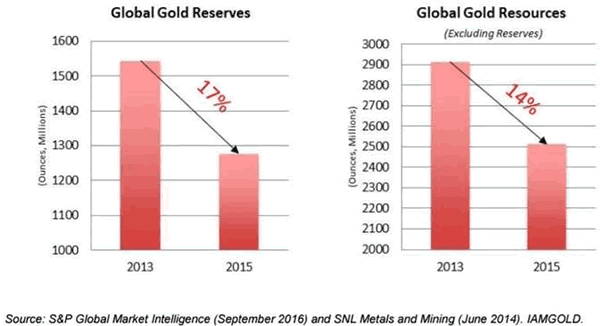
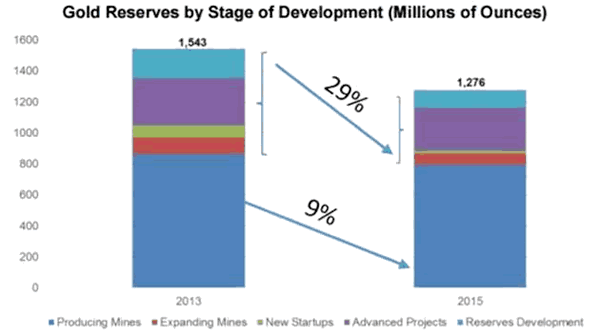
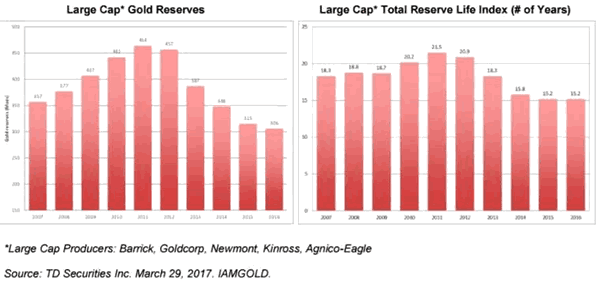
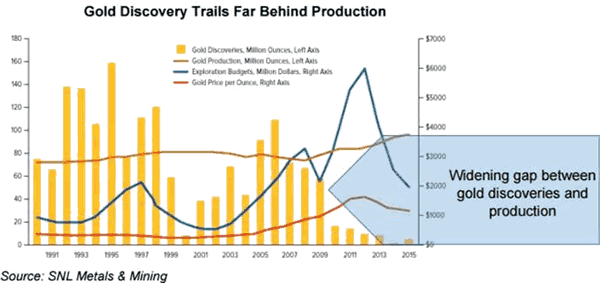
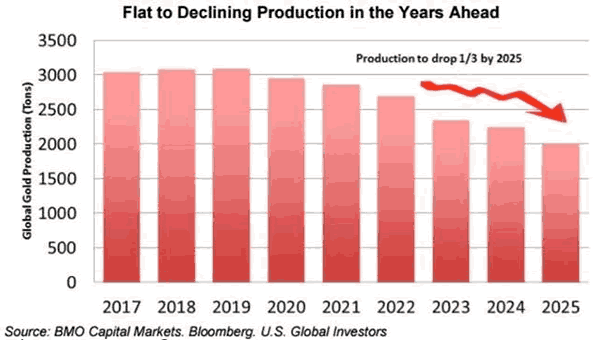
Mined Gold Peak Production
Mined peak gold production was expected in 2015. I'm going to suggest, with the help of the following charts, it might very well of been Q3, 2016.
According to the World Gold Council mined gold totaled 3,236t in 2016, virtually unchanged from 2015. Production peaked in Q3 2016, when 850.4t was brought on to the market, before falling back to 810.9t in Q4 (-2% y-o-y).
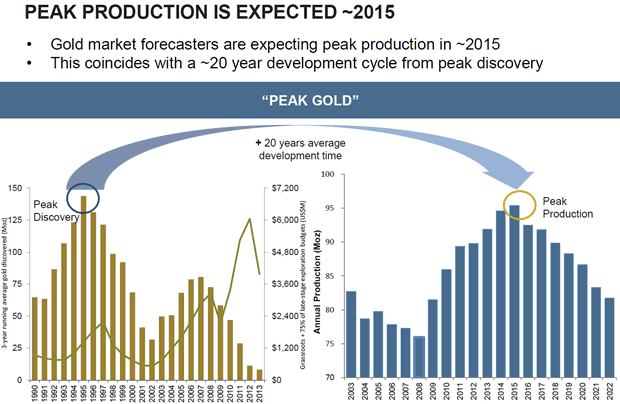
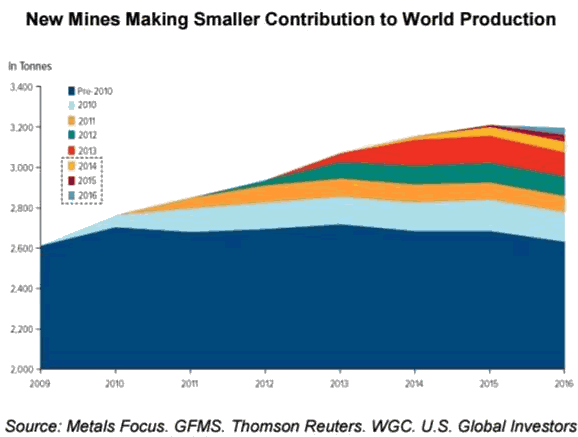
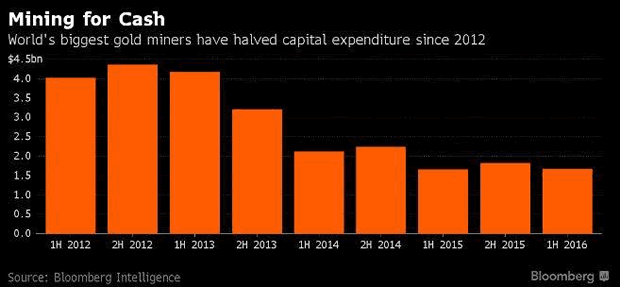
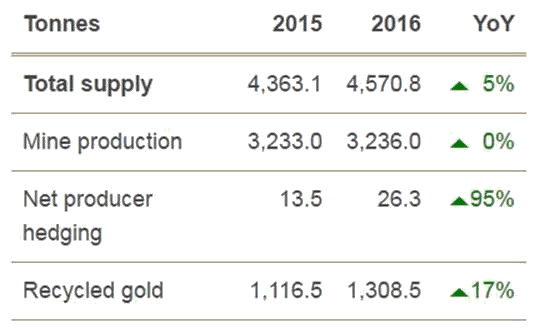
Mined gold totaled 3,236t in 2016, virtually unchanged from 2015
Conclusion
Are the tanks going to roll, the missiles fly? Is economic collapse and/or war in our near to medium term future? I'm not betting against either, one or both seem a real possibility to your author.
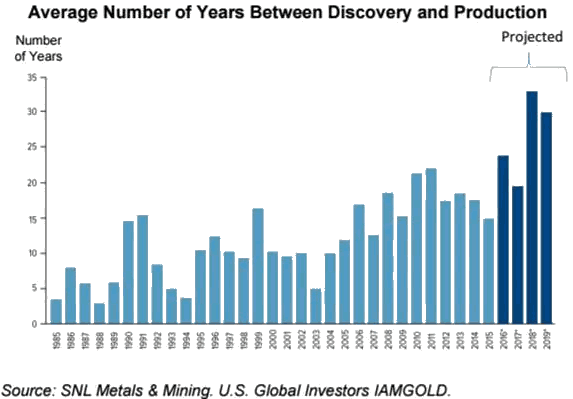
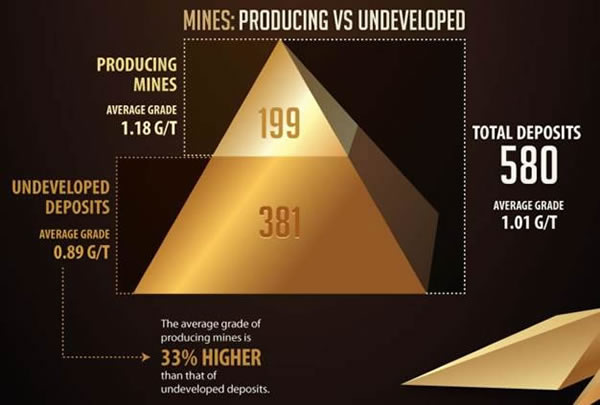
Have we indeed reached mined peak gold production? With future mines being on average much lower grade then mines currently in production, at the very least, considering it takes up to 20 years from discovery to production, it's not hard to believe we are have reached peak mined gold for this mining cycle.
Only time will tell for sure. But if I was looking (and I always am), for superior investment vehicles to take advantage of what I think I know regarding the future I'd be buying gold and silver bullion and near term gold and silver producers.
Historically junior resource precious metal focused companies have offered the greatest leverage to increasing demand and a rising gold/silver price.
Leveraging into junior gold and silver companies owning the better precious metal projects should be on all our radar screens.
Is there at least one soon to be junior gold producer on your radar screen? I have two on my mine, have you got any on your screen?
If not, maybe it should be.
By Richard (Rick) Mills
If you're interested in learning more about the junior resource and bio-med sectors please come and visit us at www.aheadoftheherd.com
Site membership is free. No credit card or personal information is asked for.
Richard is host of Aheadoftheherd.com and invests in the junior resource sector.
His articles have been published on over 400 websites, including: Wall Street Journal, Market Oracle, USAToday, National Post, Stockhouse, Lewrockwell, Pinnacledigest, Uranium Miner, Beforeitsnews, SeekingAlpha, MontrealGazette, Casey Research, 24hgold, Vancouver Sun, CBSnews, SilverBearCafe, Infomine, Huffington Post, Mineweb, 321Gold, Kitco, Gold-Eagle, The Gold/Energy Reports, Calgary Herald, Resource Investor, Mining.com, Forbes, FNArena, Uraniumseek, Financial Sense, Goldseek, Dallasnews, Vantagewire, Resourceclips and the Association of Mining Analysts.
Copyright © 2017 Richard (Rick) Mills - All Rights Reserved
Legal Notice / Disclaimer: This document is not and should not be construed as an offer to sell or the solicitation of an offer to purchase or subscribe for any investment. Richard Mills has based this document on information obtained from sources he believes to be reliable but which has not been independently verified; Richard Mills makes no guarantee, representation or warranty and accepts no responsibility or liability as to its accuracy or completeness. Expressions of opinion are those of Richard Mills only and are subject to change without notice. Richard Mills assumes no warranty, liability or guarantee for the current relevance, correctness or completeness of any information provided within this Report and will not be held liable for the consequence of reliance upon any opinion or statement contained herein or any omission. Furthermore, I, Richard Mills, assume no liability for any direct or indirect loss or damage or, in particular, for lost profit, which you may incur as a result of the use and existence of the information provided within this Report.
© 2005-2022 http://www.MarketOracle.co.uk - The Market Oracle is a FREE Daily Financial Markets Analysis & Forecasting online publication.