


Stock Market Volatile C-Wave
Stock-Markets / Stock Market 2017 May 22, 2017 - 12:02 PM GMTBy: Andre_Gratian

 Current Position of the Market
SPX Long-term trend: Uptrend continues.
SPX Intermediate trend: The correction from 2400 on 3/08 continues, with the B-wave now in place.
Analysis of the short-term trend is done on a daily-basis with the help of hourly charts. It is an important adjunct to the analysis of daily and weekly charts which discuss longer market trends.
Daily market analysis of the short-term trend is reserved for subscribers. If you would like to sign up for a FREE 4-week trial period of daily comments, please let me know at anvi1962@cableone.net
A volatile C-wave
Market Overview
Eight weeks after completing the A-wave of the corrective pattern on 3/27 at 2322.25, the B-wave registered a high of 205.77 on 5/16. It was followed by a quick two-day drop of fifty-three points, and a rebound of thirty-six points, one day later. All of this took place last week, with SPX closing at 2381.73.
Structurally, there are two possibilities: We have now completed either a-b or 1-2 of the C-wave, with the latter being favored because the main cycle of the cluster which lies in front of us -- if it makes its low on schedule -- is estimated to bottom on 5/31; and we need to use up almost two weeks of remaining cycle time.
Since wave 2(?) retraced just a little over .618 of the decline from point B, and gave up ten points of its bounce in the last hour on Friday, it’s a pretty good assumption that we have already made a short-term high and started on the next phase down. The close did not bring a confirmed sell signal at the hourly level, but the weekly trend is still correcting, and the daily remains in a downtrend. Everything considered, wave C should bring about a new low to the correction.
Analysis: (These Charts and subsequent ones courtesy of QCharts.com)
Daily chart
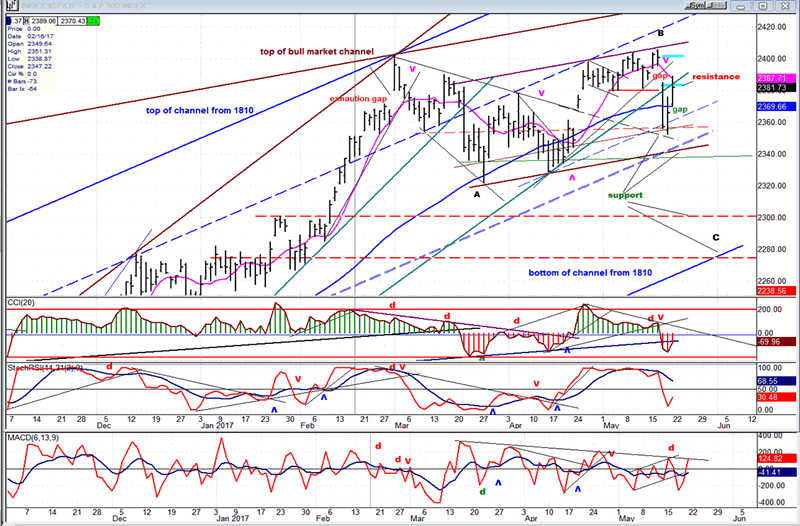
As we discussed before, we are undergoing a correction of the uptrend phase which started at 2084 and ended at about 2400. There was a count taken at the 2084 low which targetted a top at 2400 with a possible extension to 2410. The 2400 count was filled exactly at the first top and, after wave A of the correction completed at 2322, we finally got to point B nearly two months later. The index did not quite make it to its extension projection, failing to reach it by about 4 points. Close enough for a count which was taken nearly five months ago, and 325 points lower.
The corrective pattern is forming within the confines of the intermediate channel from 1810 (blue lines), and at the top of the bull market channel (brown). Parallels to these major trend lines have been very useful in determining the various starting and stopping points of the minor trends within the structure. The main body of the pattern is trading between the two parrallel brown lines, and the index is expected to break below the lower one before the correction comes to an end. The distribution pattern which has formed at the top has given us counts which will help guesstimate the final price low of the correction. There are a couple of possibilities which fall in the vicinity of the horizontal dashed red lines. A confirming count is in the process of forming and, as soon as we are certain that Friday’s uptrend has come to an end, we should be able to select the one which comes closest to being correct.
The oscillators are behaving as they should. They identified the end of the A wave and the top of the B wave, and are expected to identify the bottom of the C wave and the end of the correction. They turned up with Friday’s rally, but remain in a sell mode. However, if the bottom index (A/D) should develop some upward momentum next week, it will alert us that something other than what we expect for the rest of the correction is taking place. We can never underestimate the market and must remain vigilant at all times.
Hourly chart
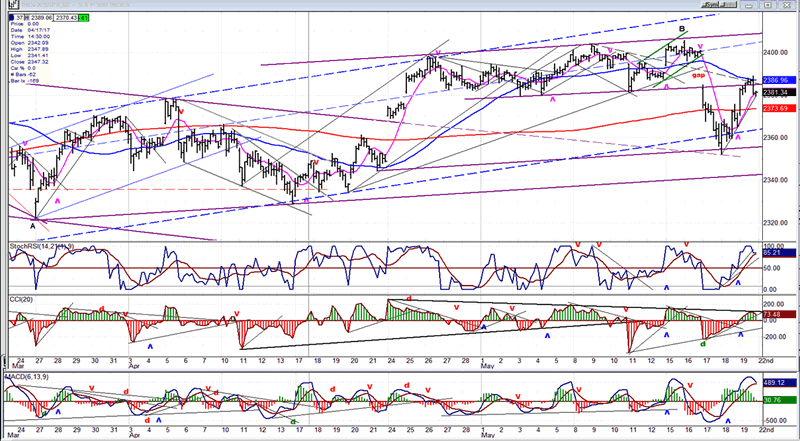
I have been accused of using too many trend lines on my charts. It is true that I could do with a few less, but it does not mean that the ones that are there do not serve a purpose. If you look at them closely, you will see that they all identify support and resistance levels as well as price channels. Some, like the one which runs diagonally across the chart when extended (dashed), identified the initial low of the decline from the B top. I must confess, however, that I did not catch that until after the fact! I drew it on the chart as an example of the amazing properties of trend lines. The extension of a small trend line at the top, also served to identify the tip of Friday’s rally.
The countertrend also found resistance at the brown trend line which joins the former minor lows, and at the blue 55-hr MA. As mentioned above, this is also slightly more than a .618 retracement of the decline from B. It is not unusual for prices to fluctuate on both sides of the red (233-hr) MA, but it can also be precise for locating short-term support and resistance points -- as you can see on the left side of the chart.
With the last hour pull-back in the index, all the oscillators turned down, but there was not enough time left for them to make a bearish cross. If we have made a top (which is very likely) this should occur on Monday. If the rally continues, it will be time to revise our analysis.
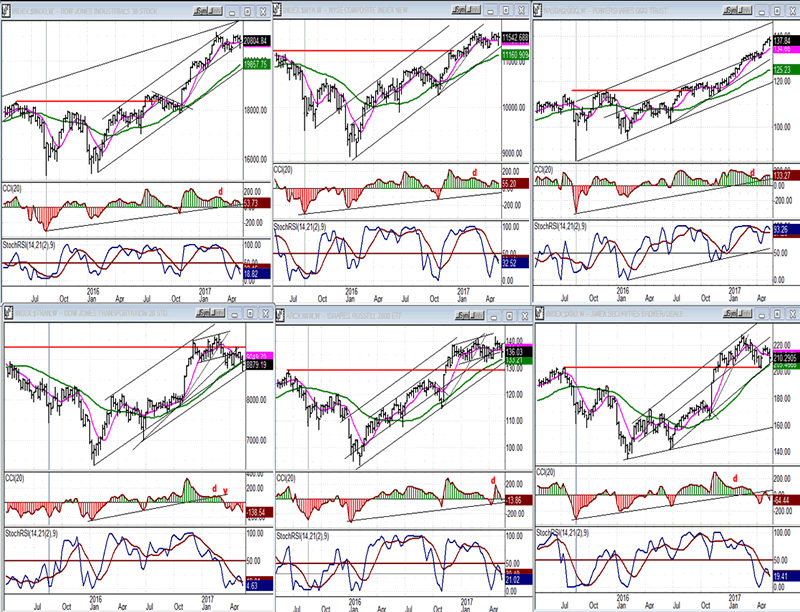
- An overview of some important indexes (Weekly charts)
- The correction remains shallow with QQQ (top right) finally joining in by pulling back a couple of points. TRAN (bottom left) made a new low and remains the weakest index of the group. We should keep in mind that it is often not one, but two steps ahead of the market when we try to understand what it is telling us.
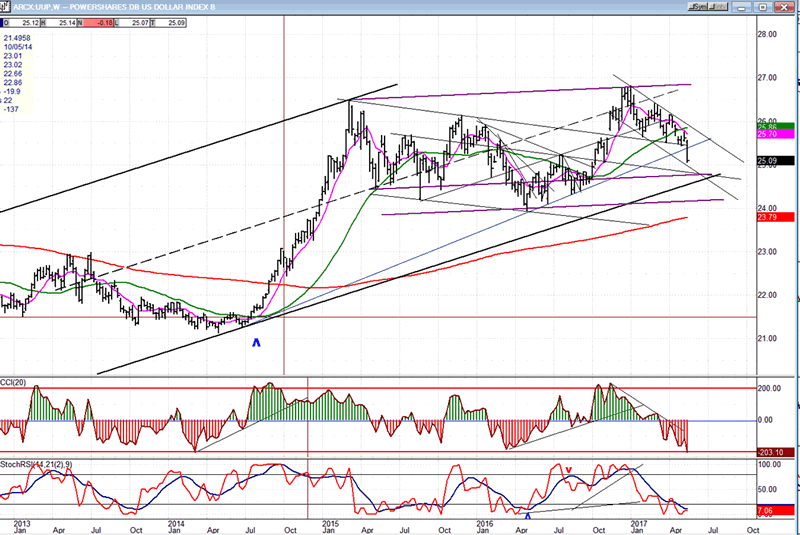
- UUP (dollar ETF)
- The weekly chart is giving us a better perspective on UUP’s current behavior. The consolidation which started after making a 7-year high is turning into an extension of the ongoing corrective pattern. Last week, UUP broke an intermediate trend line, and this has brought it closer to the bottom line of the intermediate channel. As long as price remains within its confines, UUP could steady itself and make another attempt at reaching a new high. If not, there is a risk that a major top has been seen and that another long-term downtrend is starting.
- GDX (Gold Miners ETF)
- It is also helpful to look at GDX on a weekly chart. The index has reached an area of strong resistance caused by the intersection of trend lines and MAs. If it is only mildly repelled, it will be a sign that the next move could be a break-out move on its way to a new high. A couple more half-point reversals on the 1X P&F chart would create a bullish pattern and give us a potential target for the next uptrend.
- For now, the bias is bullish, but if GDX were to break below 18.50, it would look as if a re-test of the 12.50 low was in the offing.
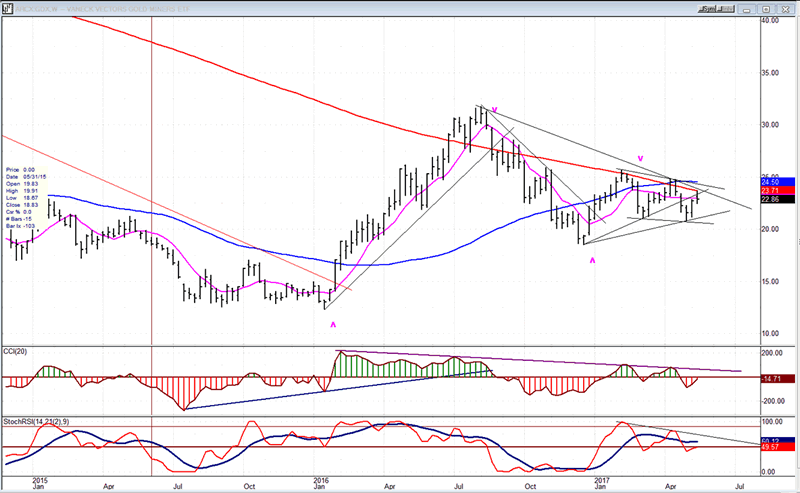
- Note: GDX is now updated for subscribers throughout the day, along with SPX.
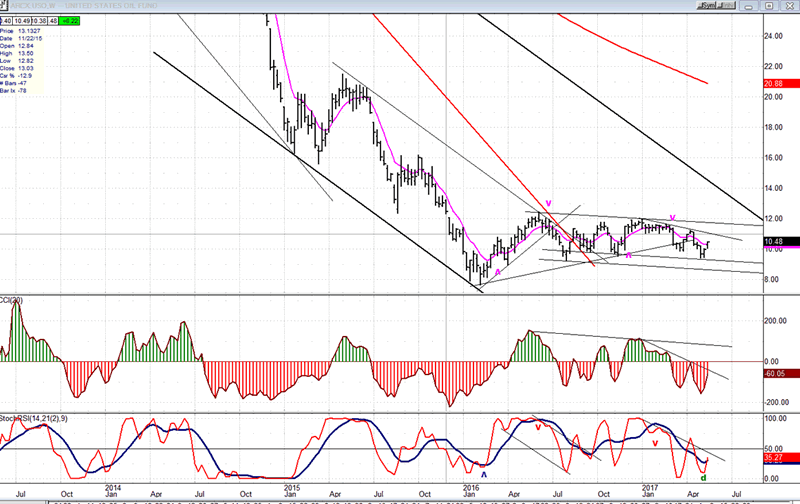
- USO (U.S. Oil Fund)
- After suffering a major decline from 119 to 8, the index was expected to spend several months building a base before it could attempt establishing another uptrend. This is what it is doing, and it is still a work in progress. Several more weeks may be necessary before the foundation has been laid to complete the task. If it is ready sooner, it will show up in the oscillators.
- Summary:
- The B-wave of the corrective pattern should now be in place and the C-wave underway. What structure it decides to adopt will be revealed next week.
- Already, a decline of 53 points followed by a .618 retracement suggests that the next move should be lower, with confirmation coming Monday. Should the index extend its rally instead, it may necessitate a different interpretation of its behavior from the one provided above.
Andre
For a FREE 4-week trial, send an email to anvi1962@cableone.net, or go to www.marketurningpoints.com and click on "subscribe". There, you will also find subscription options, payment plans, weekly newsletters, and general information. By clicking on "Free Newsletter" you can get a preview of the latest newsletter which is normally posted on Sunday afternoon (unless it happens to be a 3-day weekend, in which case it could be posted on Monday).
Disclaimer - The above comments about the financial markets are based purely on what I consider to be sound technical analysis principles uncompromised by fundamental considerations. They represent my own opinion and are not meant to be construed as trading or investment advice, but are offered as an analytical point of view which might be of interest to those who follow stock market cycles and technical analysis.
Andre Gratian Archive |
© 2005-2022 http://www.MarketOracle.co.uk - The Market Oracle is a FREE Daily Financial Markets Analysis & Forecasting online publication.