


SPX/NDX/NAZ Hit New All-time Highs
Stock-Markets / Stock Market 2017 May 27, 2017 - 04:29 PM GMTBy: Tony_Caldaro

 The market started the week at SPX 2382. After a gap up opening on Monday the market continued to rally until it hit a new high at SPX 2419 on Thursday. After that there was a small pullback to end the week at SPX 2416. For the week the SPX/DOW gained 1.35%, and the NDX/NAZ gained 2.25%. Economic reports for the week were mostly negative. On the downtick: new/existing home sales, durable goods, consumer sentiment, the Q2 GDP estimate, plus weekly jobless claims rose. On the uptick: Q1 GDP and the WLEI. Next week’s reports will be highlighted by monthly payrolls and the FED’s beige book.
LONG TERM: uptrend
The updated count we have been using on the NAZ for a few weeks appears to be the correct one. So we updated the NDX charts to display the same Int. wave iii underway count. This coincides quite well with the SPX/DOW counts, that suggest Minor wave 5 of Int. wave iii is underway. As with nearly all fifth waves we have been observing negative divergences on their weekly charts. Will the market just ignore it, and keep going higher? Or after the short term patterns complete, will we see the largest correction since early 2016? Fourth waves (Int. iv) in recent years have been notoriously steep.
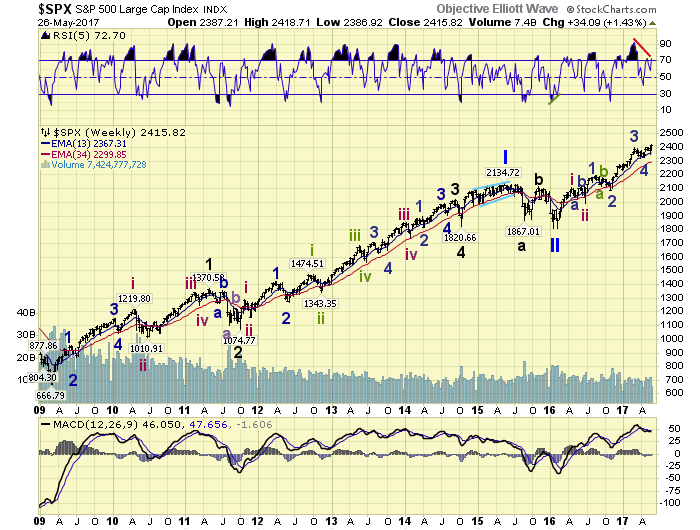
Long term the OEW SPX wave count continues too look correct. A Primary II low in early 2016, with Primary III underway. Intermediate waves i and ii ended in the spring of 2016, with Int. iii underway since then. Minor waves 1 and 2 ended in the fall of 2016, and Minor waves 3 and 4 ended in the spring of 2017. Minor wave 5, which completes Int. iii, has been underway since April.
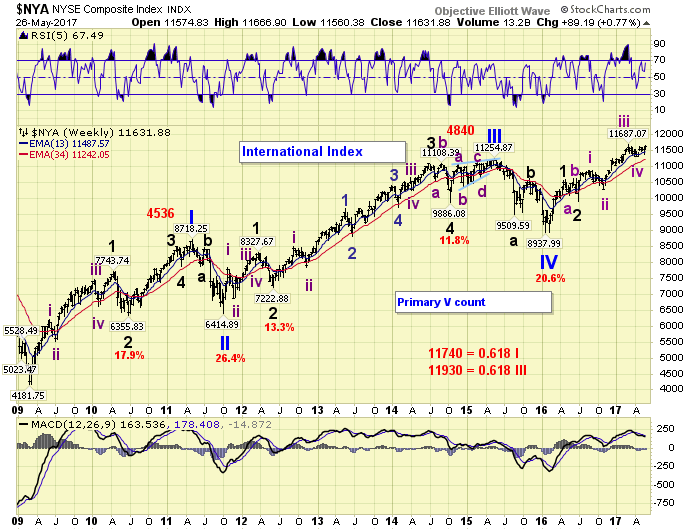
For those still holding onto the Primary V count since 2009. They may get their opportunity soon, to find out if it is correct or not. We continue to carry this alternate count on the NYSE charts. Notice that this count suggests Int. v of Major 3 is currently underway. After it completes a Major 4 correction will follow. Then Major 5 should end Primary V. This is not our preferred count, but it is preferred by most Elliott Wavers.
MEDIUM TERM: uptrend
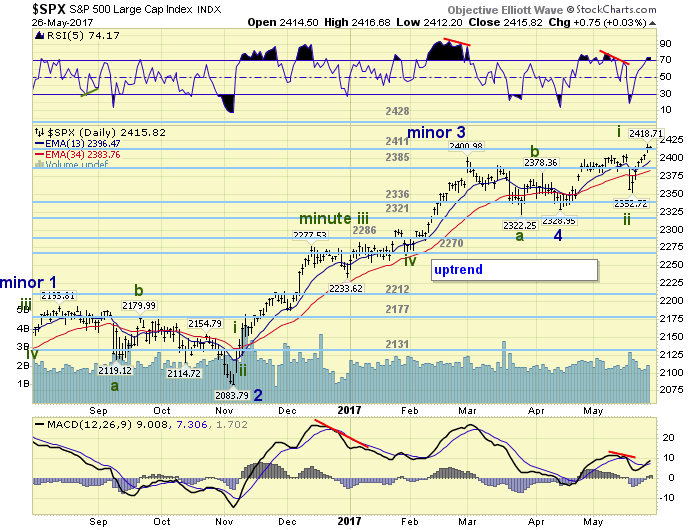
The Minor 5 uptrend, from the Minor 4 SPX 2329 low, finally broke through the SPX 2400-ish level this week. That level had kept the market in check since early-March. Minor 5 appears to be subdividing into five Minute waves: 2406-2353-2419 so far. With this rally we can now make some potential targets for the high of Intermediate wave iii.
While the market has now generated several higher OEW pivots, there are two sets of these pivots that are clustered together. Clustered pivots often offer far more resistance then standalone pivots. The first cluster is between the 2444 and 2456 pivots, the second between the 2524 and 2531 pivots. If the first doesn’t stop this uptrend, the second likely will. Medium term support is at the 2411 and 2385 pivots, with resistance at the 2428 and 2444 pivots.
SHORT TERM
From the downtrend low at SPX 2329 we counted 5 waves up to SPX 2406 on one timeframe, and 9 waves up on a shorter timeframe. Since both were impulse patterns we expected higher prices after a pullback. The pullback, however, was much larger than expected: 2406-2353. But the market rebounded quickly by making new all-time highs the following week. As a result we upgraded the labeling to SPX 2406 Minute i, SPX 2353 Minute ii, and SPX 2419 Minute iii so far.
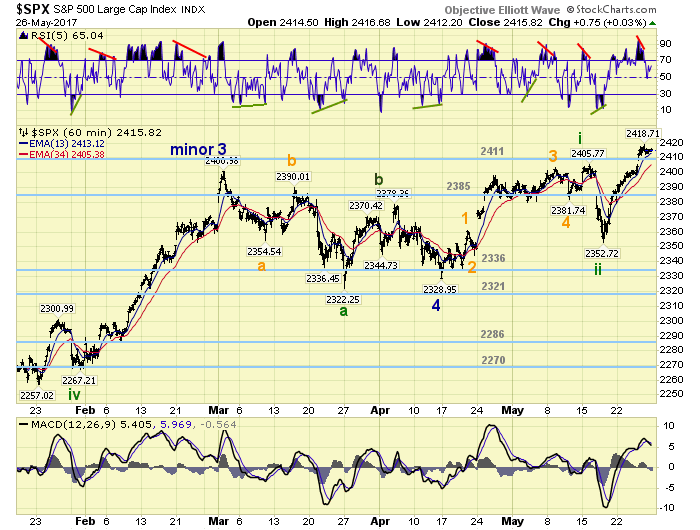
Minute iii has been quite steady and strong, 66-points, and it has not had a notable pullback since it began. The strongest rally during Minute i was 53-points, during the 3 of 3 portion of that wave. This suggests one of two things: (1) Minute iii may not have a pullback until it ends, or (2) Minute iii will be quite strong with subdivisions of its own. Will leave both open as possibilities. Short term support is at the 2411 and 2385 pivots, with resistance at the 2428 and 2444 pivots. Short term momentum ended the week above neutral. Best to your trading!
FOREIGN MARKETS
Asian markets were all higher on thee week for a 1.4% gain.
European markets were mixed and ended mixed.
The DJ World index gained 0.9%, and the NYSE gained 0.8%.
COMMODITIES
Bonds are trying to uptrend but ended flat on the week.
Crude is trying to uptrend and gained 1.7% on the week.
Gold is also trying to uptrend and gained 1.2% on the week.
The USD remains in a downtrend but gained 0.2% on the week.
NEXT WEEK
Monday: holiday. Tuesday: personal income/spending and the CPI at 8:30, Case-Shiller at 9am, then consumer confidence at 10am. Wednesday: the Chicago PMI and pending home sales. Thursday: the ADP, weekly jobless claims, ISM, construction spending and auto sales. Friday: monthly payrolls and the trade deficit.
CHARTS: http://stockcharts.com/public/1269446/tenpp
After about 40 years of investing in the markets one learns that the markets are constantly changing, not only in price, but in what drives the markets. In the 1960s, the Nifty Fifty were the leaders of the stock market. In the 1970s, stock selection using Technical Analysis was important, as the market stayed with a trading range for the entire decade. In the 1980s, the market finally broke out of it doldrums, as the DOW broke through 1100 in 1982, and launched the greatest bull market on record.
Sharing is an important aspect of a life. Over 100 people have joined our group, from all walks of life, covering twenty three countries across the globe. It's been the most fun I have ever had in the market. Sharing uncommon knowledge, with investors. In hope of aiding them in finding their financial independence.
Copyright © 2017 Tony Caldaro - All Rights Reserved Disclaimer: The above is a matter of opinion provided for general information purposes only and is not intended as investment advice. Information and analysis above are derived from sources and utilising methods believed to be reliable, but we cannot accept responsibility for any losses you may incur as a result of this analysis. Individuals should consult with their personal financial advisors.
Tony Caldaro Archive |
© 2005-2022 http://www.MarketOracle.co.uk - The Market Oracle is a FREE Daily Financial Markets Analysis & Forecasting online publication.