


How One Forecasting Tool Defied the Stocks Bull Market Naysayers
Stock-Markets / Stock Market 2017 Jun 13, 2017 - 03:02 PM GMTBy: EWI

 Three compelling Elliott wave charts lay it all out
The Elliott wave model often indicates a stock market outlook that's at odds with the sentiment of the crowd.
But, that's okay. The crowd is usually wrong at major market turns.
For example, two years ago on May 9, 2015, the bull market was six years old
and the third longest in history. A few days earlier, CNN Money said:
As the bull market gets longer and longer, investors are getting jittery.
A chart we created shows the then six-year uptrend and reiterates the sentiment of that time:
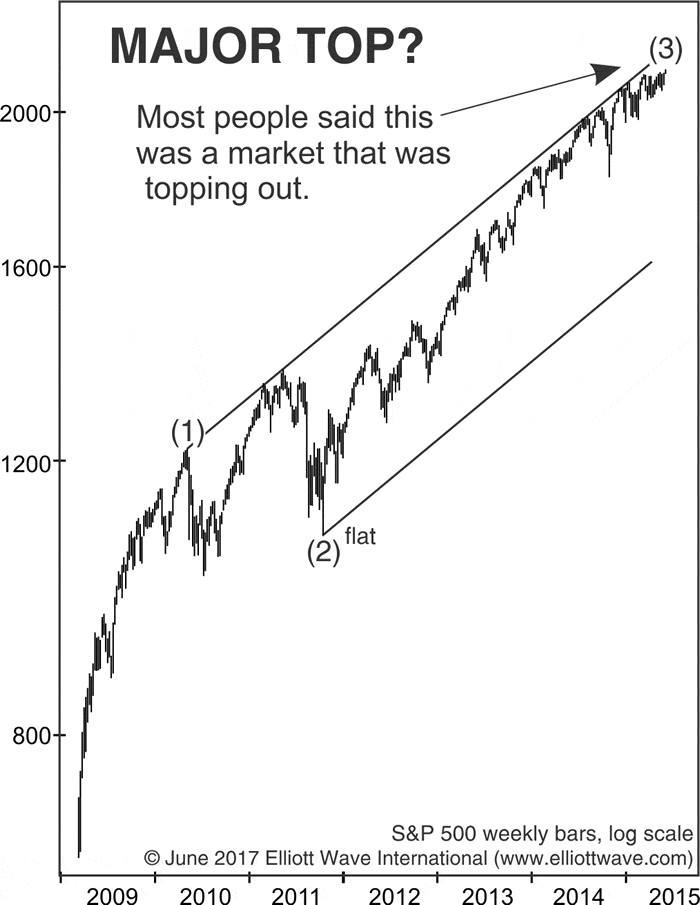
A stock market high did occur in May 2015, but it wasn't THE high, as many investors expected.
As the chart shows, the S&P 500's rise through that time completed a third wave, the longest and strongest part of a financial trend. Yet, major trends, whether bull or bear, advance or decline in five waves. Our model expected a wave 4 correction to follow – and then a wave 5 that would take stocks to higher highs.
In the Elliott wave model, waves one, three and five move in the same direction as the main trend. Waves two and four are countertrend moves. On the chart, you can see the decline represented by wave (2). Following the wave (3) advance, as you can see on the next chart, the reversal of wave (4) stretched into the early part of 2016:
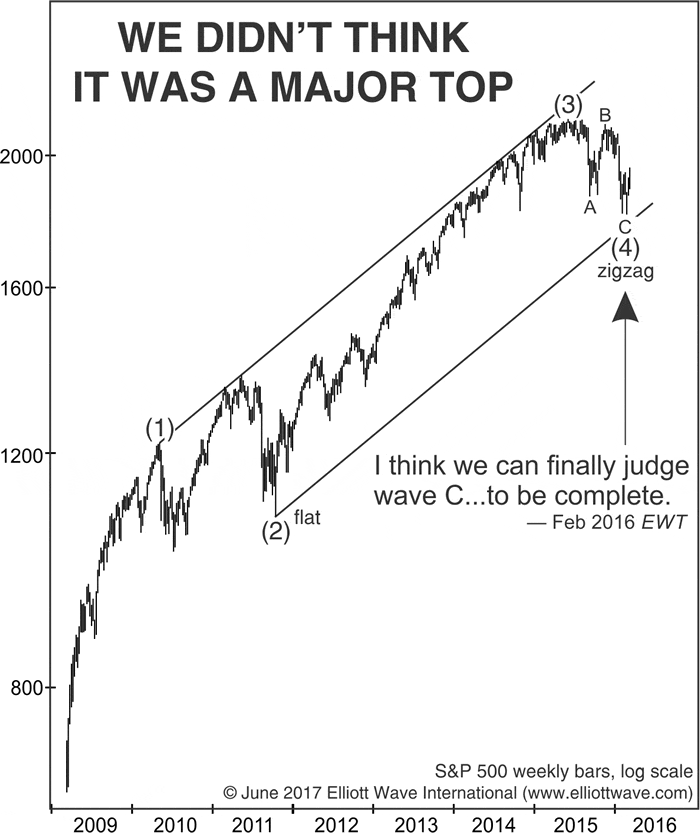
Indeed, in February 2016, our Elliott Wave Theorist said:
...we can finally judge wave C ...to be complete.
What that meant was that a year and a half ago, wave (4) was complete -- and wave (5) up to new highs was set to start.
Even so, around that time, two financial websites showed identical headlines:
- Is the Bull Market Over? (Motley Fool, Jan. 23, 2016)
- Is the bull market over? (CNBC, March 9, 2016)
The second headline published on the seventh anniversary of the bull market, prompting market writers to question the sustainability of the bull market.
But the market's Elliott wave pattern is not beholden to anniversaries or any other such factors.
How has the February 2016 Theorist's forecast played out? Well, as it's been said, a picture is worth a thousand words. Take a look:
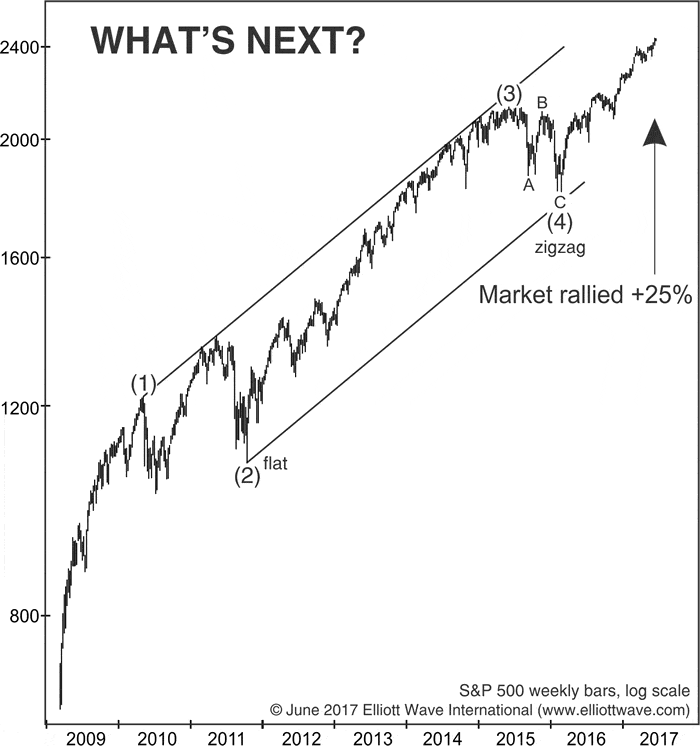
Yes, since the Theorist nailed the completion of wave (4), the S&P 500 has rallied more than 25%.
You've just seen an example of why our subscribers are convinced of the Elliott wave model's value.
Now, it's up to you to get the details of what we anticipate next.
Here's the good news: You can read the entire 10-page March 2017 Elliott Wave Theorist 100% FREE -- but only for a limited-time. Read below for details.
Get a free issue of market legend Robert Prechter's Elliott Wave Theorist now
Read this eye-opening issue now and you'll get a clear picture of what's next for stocks, bonds and oil and more to help you jump on opportunities and sidestep risk. This free issue (a $29 value) will show you Prechter's unique outlook and give you a new perspective on the markets you won't get anywhere else.
Download your FREE issue from Robert Prechter now – for a limited time.
This article was syndicated by Elliott Wave International and was originally published under the headline How One Forecasting Tool Defied the Bull Market Naysayers. EWI is the world's largest market forecasting firm. Its staff of full-time analysts led by Chartered Market Technician Robert Prechter provides 24-hour-a-day market analysis to institutional and private investors around the world.
© 2005-2022 http://www.MarketOracle.co.uk - The Market Oracle is a FREE Daily Financial Markets Analysis & Forecasting online publication.