


Gold to Silver Ratio - Preparing for THE Bottom
Commodities / Gold and Silver 2017 Jul 12, 2017 - 09:18 AM GMTBy: P_Radomski_CFA

 In the first part of the Preparing for THE Bottom series, we emphasized the need to be sure to stay alert and focused in the precious metals market, even though it may not appear all that interesting. We argued that preparing for the big moves in gold that are likely to be seen later this year should prove extremely worth one’s while. In the second part of the series, we discussed when, approximately, one can expect the key bottom in gold to form (reminder: this winter appears a likely target).
In today’s issue, we would like to feature one of the signs that are likely to confirm that the final bottom is indeed in. The thing that a relatively small number of investors follow (mostly those who have been interested in the sector for some time) are the intra-market ratios. One of the most important ones is the gold to silver ratio and to be honest, it’s no wonder that this ratio is so important – after all, gold and silver are the parts of the precious metals sector that practically everyone recognizes.
Due to both metals’ popularity and the fact that different types of investors tend to focus on them (gold is more popular among institutions and, generally, big investors, while silver is particularly desired by smaller, individual investors), their relative performance can tell us quite a lot about the situation in the sector. This includes helping to detect and confirming the major turning points in gold and silver.
Let’s take a closer look at the ratio (charts courtesy of http://stockcharts.com and macrotrends.net).
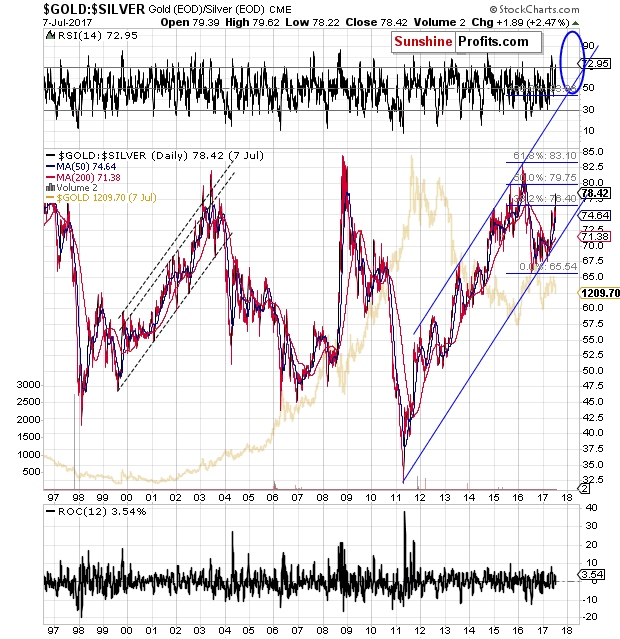
The first thing that comes to mind while looking at the above chart is that the tops in the ratio usually correspond to bottoms in the precious metals market - silver tends to underperform gold to a big extent in the final part of the decline. The mid-2003 spike in the ratio doesn’t directly confirm this rule (there was a local bottom at that time, though), but the 2008 spike, 2011 bottom and the 2016 spike certainly do. So, while it is not inevitable, it seems likely that the major bottom in the precious metals will be accompanied by a big upward spike in the gold to silver ratio i.e. silver’s extreme underperformance.
Having said the above, let’s move to the current trend. Despite the decline in 2016, the main direction in which the ratio is heading is still up. We marked the borders of the rising trend channel with blue lines and the ratio is still closer to the lower line than the upper one – meaning that the upside potential remains intact.
If the ratio is to continue to move higher (it’s likely, because an uptrend is intact as long as there is no confirmed breakdown below it), then we can expect the upper border of the trend channel to be reached (or breached – more on that in just a moment) before the top is in. If this is to be seen in 6 months or so (as we indicated in our previous article in this series), then we can expect the ratio to move to about 94.
This target is additionally supported by Fibonacci extensions based on the 2016 bottom, 2016 top and the 2015 top. The Fibonacci extensions work similarly to the Fibonacci retracements – they differ, because the latter provide targets between the levels that were already reached, while the former are usually used to provide targets outside of the previous trading range. In this case, we get another confirmation of 94 as an upside target.
One might ask that if the above is the case, then why didn’t we draw the target area around the 94 level, but between 94 and 100. There are two good reasons for it.
The first reason is visible on the above chart. Namely, history tends to repeat itself to a considerable extent, and during the previous steady uptrend (the 2008 lack-of-liquidity-driven spike was far from being steady) at the beginning of this century, the gold to silver ratio moved temporarily above the upper border of the trend channel (marked with dashed lines) and formed a top above it. Consequently, the upper border of the current rising trend channel may not stop the rally in the following months. Instead, a breakout above it might indicate that the key top in the ratio and the key bottom in the precious metals market are just around the corner.
The second reason for a higher target is visible on the chart below that includes even more data than the previous one.
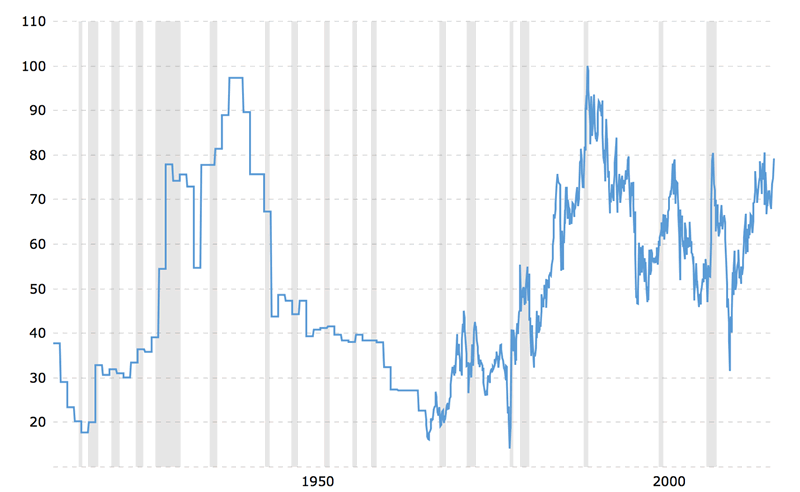
The tops that you saw on the previous chart appear to be the key long-term tops, but in reality, the key long-term tops are at / closer to the 100 level, while the ones from this century are not as important. Surely, they all are important long-term tops, however, we need to keep in mind that the strongest resistance will not be provided by the 2003 or 2008 tops, but by the 100 level.
Moreover, please note that round numbers tend to be important support and resistance levels as they tend to attract more attention (for instance, gold breaking below $1,000 will definitely get more attention than a breakdown below $1,032) – it would be difficult to find a rounder number for the ratio to reach than the 100 level.
Additionally, if the final bottom in the precious metals market was not reached in late 2015 / early 2016, because too many investors were still bullish at that time, then perhaps the extreme that the gold to silver ratio reached at that time was not extreme enough. The next resistance above the 2015 / 2016 tops is provided by the very long-term tops at or a little below 100.
So, should one ignore everything else and wait with the purchases until the gold to silver ratio spikes to 100? Of course not. That’s just one of the tools that one can use in order to determine the optimal entry prices. On a side note, please note that we wrote “optimal” instead of “final” lows. The reason is that it is not 100% certain that a bottom is in at a specified price (it can only be certain when one looks at the past prices after a longer while), so while it may be tempting to wait for the perfect target to be reached, it might be more prudent to place the buy order above the target price to greatly increase the chance of filling it at all – however, these details go beyond the topic of this essay.
When the ratio approaches its target area, all other signals will become more important – for instance gold reaching important support levels without the same action in silver or mining stocks - but with the gold to silver ratio at exactly 100 or only a bit below it and a couple other confirmations, it might be wise to invest at least partially in the entire trio (gold, silver and miners), as the confirmations would make gold’s reaching its target much more important for the entire sector than it would be without the confirmations. In other words, the gold to silver ratio serves as yet another tool in the investors’ arsenal that can help to determine whether or not the final bottom is in or at hand. It’s not a crystal ball, but one of the things one needs to keep in mind when investing capital in this promising sector. We’ll discuss other confirmations and tools in the following parts of the Preparing for THE Bottom series.
Summing up, the gold to silver ratio can provide us with an important confirmation that the final bottom in the precious metals is indeed in and while it seems that the bottom is still ahead of us, it doesn’t mean that it’s a good idea to delay preparing yourself to take advantage of this epic buying opportunity.
If you haven’t already signed up to our free gold newsletter, it may be a good idea to do so now – you’ll stay updated on our free articles (including the follow-ups to the above article) and you’ll also get 7 days of free access to our premium daily Gold Alerts as a starting bonus. Sign up today.
Thank you.
Sincerely,
Przemyslaw Radomski, CFA
Founder, Editor-in-chief
Tools for Effective Gold & Silver Investments - SunshineProfits.com
Tools für Effektives Gold- und Silber-Investment - SunshineProfits.DE
* * * * *
About Sunshine Profits
Sunshine Profits enables anyone to forecast market changes with a level of accuracy that was once only available to closed-door institutions. It provides free trial access to its best investment tools (including lists of best gold stocks and best silver stocks), proprietary gold & silver indicators, buy & sell signals, weekly newsletter, and more. Seeing is believing.
Disclaimer
All essays, research and information found above represent analyses and opinions of Przemyslaw Radomski, CFA and Sunshine Profits' associates only. As such, it may prove wrong and be a subject to change without notice. Opinions and analyses were based on data available to authors of respective essays at the time of writing. Although the information provided above is based on careful research and sources that are believed to be accurate, Przemyslaw Radomski, CFA and his associates do not guarantee the accuracy or thoroughness of the data or information reported. The opinions published above are neither an offer nor a recommendation to purchase or sell any securities. Mr. Radomski is not a Registered Securities Advisor. By reading Przemyslaw Radomski's, CFA reports you fully agree that he will not be held responsible or liable for any decisions you make regarding any information provided in these reports. Investing, trading and speculation in any financial markets may involve high risk of loss. Przemyslaw Radomski, CFA, Sunshine Profits' employees and affiliates as well as members of their families may have a short or long position in any securities, including those mentioned in any of the reports or essays, and may make additional purchases and/or sales of those securities without notice.
Przemyslaw Radomski Archive |
© 2005-2022 http://www.MarketOracle.co.uk - The Market Oracle is a FREE Daily Financial Markets Analysis & Forecasting online publication.