


Why Is The Stock Market Not Trading On Fundamentals Lately?
Stock-Markets / Stock Market 2017 Aug 09, 2017 - 09:12 PM GMTBy: Avi_Gilburt

 Last week, I noted that as long as the market maintains support over 2450SPX, we still have potential to strike the 2500SPX region before we see a top to wave (3). Currently, the market has maintained such support, so I must maintain my expectations.
“The market is just not trading on fundamentals.”
“The stock market is detached from the reality of the economy.”
“Eventually, fundamentals will matter again.”
“The market just does not make sense.”
“The fundamentals just don’t seem to matter right now.”
In fact, this past week, I actually got the following comment to one of my articles:
“Avi, with all due respect, while you have been largely right from a technical perspective, the fundamentals are not present . . .”
Yes, I chuckled at that comment. It is almost like this person was saying, “even though you have been making a lot of money on the long side, the market is wrong because the fundamentals don’t agree.” Well, I would imagine the next words out of this person’s mouth should have been “now give back all the money you made on the long side, because the market was wrong to give it to you in the first place.” (smile)
Over the last several months, I have heard every single derivative of these sentiments. Yes, many are frustrated because the market is just not making sense to them.
They have applied all the common matrices to the market, including P/E ratios, length of market rally, debt ratios, etc. And, no matter what matrix they apply, they all come to the same conclusion that, based upon fundamentals, the market is just not making any sense.
But, one has to question whether the fundamentals are what really drive the market. I have written this example in the past, as it illustrates why fundamentals really lag the market rather than drive the market:
During his tenure as chairman of the Federal Reserve, Alan Greenspan testified many times before various committees of Congress. In front of the Joint Economic Committee, Greenspan noted that markets are driven by "human psychology" and "waves of optimism and pessimism." Ultimately, as Greenspan correctly recognized, it is social mood and sentiment that moves markets. I believe this makes much more sense when deriving the causality chain.
During a negative sentiment trend, the market declines, and the news seems to get worse and worse. Once the negative sentiment has run its course after reaching an extreme level, and it's time for sentiment to change direction, the general public then becomes subconsciously more positive. You see, once you hit a wall, it becomes clear it is time to look in another direction. Some may question how sentiment simply turns on its own at an extreme, and I will explain to you that many studies have been published to explain how it occurs naturally within the limbic system within our brains.
When people begin to turn positive about their future, they are willing to take risks. What is the most immediate way that the public can act on this return to positive sentiment? The easiest is to buy stocks. For this reason, we see the stock market lead in the opposite direction before the economy and fundamentals have turned. In fact, historically, we know that the stock market is a leading indicator for the economy, as the market has always turned well before the economy does. This is why R.N. Elliott, whose work led to Elliott Wave theory, believed that the stock market is the best barometer of public sentiment.
Let's look at the same change in positive sentiment and what it takes to have an effect on the fundamentals. When the general public's sentiment turns positive, this is the point at which they are willing to take more risks based on their positive feelings about the future. Whereas investors immediately place money to work in the stock market, thereby having an immediate effect upon stock prices, business owners and entrepreneurs seek loans to build or expand a business, which takes time to secure.
They then place the newly acquired funds to work in their business by hiring more people or buying additional equipment, and this takes more time. With this new capacity, they are then able to provide more goods and services to the public, and, ultimately, profits and earnings begin to grow - after more time has passed.
When the news of such improved earnings finally hits the market, most market participants have already seen the stock of the company move up strongly because investors effectuated their positive sentiment by buying stock well before evidence of positive fundamentals are evident within the market. This is why so many believe that stock prices present a discounted valuation of future earnings.
Clearly, there is a significant lag between a positive turn in public sentiment and the resulting positive change in the underlying fundamentals of a stock or the economy, especially relative to the more immediate stock-buying activity that comes from the same causative underlying sentiment change.
This is why I claim that fundamentals are a lagging indicator relative to market sentiment. This is also why fundamentalists can be left holding the bag at the top of a market, when the news and fundamentals look the most attractive, right before the market begins to dive, as sentiment turns in the opposite direction well before the fundamentals, just like it did at the bottom.
This lag is a much more plausible reason as to why the stock market is a leading indicator, as opposed to some form of investor omniscience. This also provides a plausible reason as to why earnings lag stock prices, as earnings are the last segment in the chain of positive mood effects on a business growth cycle. It is also why those analysts who attempt to predict stock prices based on earnings fail so miserably at market turns.
By the time earnings are affected by a change in social mood, the social mood trend has already been negative for some time. And this is why economists fail as well - the social mood has shifted well before they see evidence of it in their "indicators."
So, rather than consider the obvious conclusion - that fundamentals are not driving the market (God forbid one even consider such heresy) – many would rather entertain perspectives of such outright conjecture as to relegate their perspectives to complete fantasy. You see, a significant number of people believe that the PPT (Plunge Protection Team) has been working overtime to “buy every dip.”
Now, in the past, I have presented my perspective as to why I believe that the PPT being able to stop market corrections is complete fantasy in and of itself. And, I use many specific market examples to prove my point.
Sentiment Speaks: Central Banks Control Nothing
As presented in my market history research in the linked article, I don’t believe the PPT has been able to stop any major declines during the years they have supposedly been in action. But, to believe the PPT is going to be involved in the market when it's making new all-time highs weekly is just too ludicrous to take seriously. So, why have ordinarily reasonable people resigned themselves to believing in fantasy?
The answer is because they simply have no better resolution for their conundrum as to why the market is not trading on fundamentals. So, they simply assume that someone is controlling the market and preventing it from trading upon fundamentals. Well, as a child, I learned at a young age what happens when one ASS-U-ME’s.
Allow me to also remind you about the conclusion of one of the leading economists in the world today. In a paper written by Professor Hernan Cortes Douglas, former Luksic Scholar at Harvard University, former Deputy Research Administrator at the World Bank, and former Senior Economist at the IMF, he noted the following regarding those engaged in “fundamental” analysis for predictive purposes:
The historical data says that they cannot succeed; financial markets never collapse when things look bad. In fact, quite the contrary is true. Before contractions begin, macroeconomic flows always look fine. That is why the vast majority of economists always proclaim the economy to be in excellent health just before it swoons. Despite these failures, indeed despite repeating almost precisely those failures, economists have continued to pore over the same macroeconomic fundamentals for clues to the future. If the conventional macroeconomic approach is useless even in retrospect, if it cannot explain or understand an outcome when we know what it is, has it a prayer of doing so when the goal is assessing the future?
So, when you see with your own eyes that the market is not trading on fundamentals, why would you consider that fundamentals ever control the market? Do you even consider that fundamentals really don’t drive the market?
Recognize that when the market finally begins to trade in the direction suggested by fundamentals, the fundamentals then are really a coincidental factor, rather than a controlling one. Otherwise, you have to believe that fundamentals only control the market “some of the time.” Does that really make sense? Do you control the action of your arm only some of the time? Either you control your arm or you don’t. Either someone is pregnant, or they are not. There is no such thing as a little pregnant.
To believe otherwise is to suspend reason and logic for the sake of clinging to an outdated market perspective simply because it is commonly accepted. So, consider how you did when you adopted the commonly accepted perspective about the market for Brexit, Frexit, terrorist attacks, interest rate hikes, cessation of QE, Trump’s election, etc.!? Remember, the world was once commonly accepted to be flat too.
“In the dark ages, the world was supposed to be flat. We persist in perpetuating similar delusions.”
R. N. Elliott, Natures Law, 1946
Over the past week, the market has provided us with a very overlapping structure that does not provide much in the way of a high probability very short-term expectation. You see, the structure can be considered as a b-wave in a more expanded corrective structure, which can still loop down to the 2450SPX region before starting its final rally to 2500SPX. Yet, the more immediately bullish interpretation already has us in wave v of its final move towards 2500SPX.
So, unfortunately, there will be times like this where the market does hide its true short-term intention. But, I believe most market participants should take a step back and recognize where we are in the bigger picture.
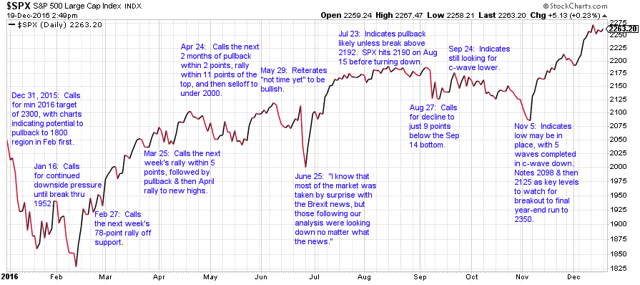
Last year at this time, we had our sites initially on the 2300-2330SPX region for 2016, as you can see from the attached re-cap of our market calls through 2016.
While we certainly struck that region as we expected, we then moved our thoughts for 2017 towards 2410-2440 for wave (iii) of (3), which was also struck as expected, which then elicited a pullback towards 2333SPX, which we expected to be struck for wave (iv) of (3). As you can see from the chart below, the market has been acting in an almost textbook fashion in between our Fibonacci Pinball target regions.
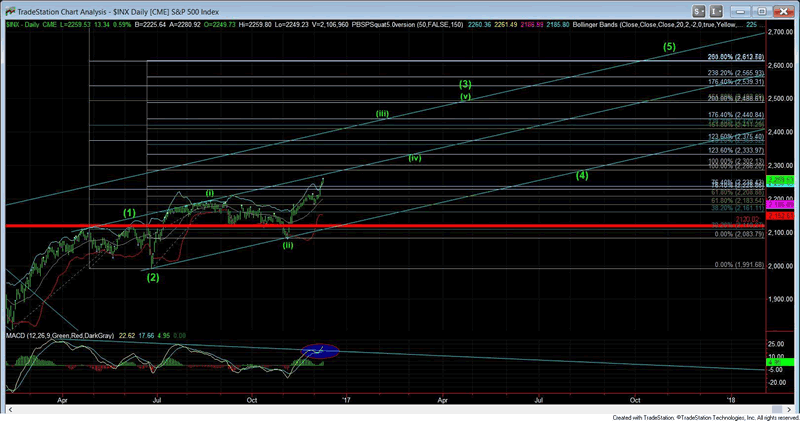
We then focused our attention towards our next bigger target in the 2487-2500SPX region, where we expected that wave (3) would complete. Currently, we stand just below the target region we set last year for wave (3).
And, as I reminded the members of my trading room this past week:
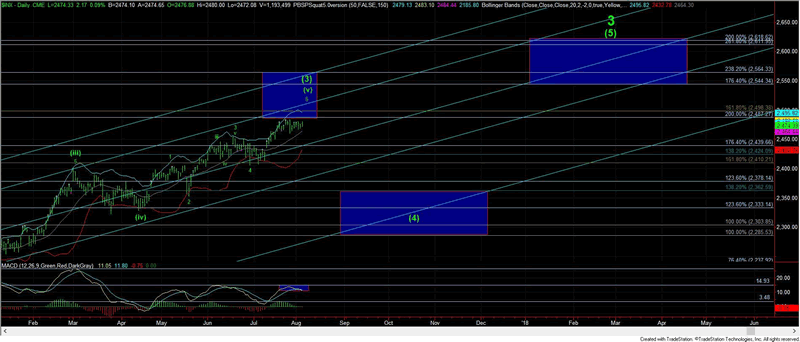
You see, we have now just about struck the 1.618 extension of waves (1) and (2) off the February 2016 lows, which is the most common target of wave (3). Moreover, we are striking the 2.00 extension of waves (i) and (ii) within wave (3), which is also where wave (v) of (3) commonly tops. They are both coinciding around the 2500SPX region, which is what we consider a strong confluence region for a top to be struck in wave (3).
Moreover, as I explained to the members in my trading room several weeks ago, the daily MACD on the SPX has been providing us evidence that strongly supports our expectation for the market to be topping out quite soon in all of wave (3) off the February 2016 lows. We have seen the divergences we would normally see at each stage of this rally, and the current divergences may need one more micro divergence before wave (3) is done. But, the patterns and divergences are matching up quite nicely to suggest that the market is just about done with wave (3).
So, my main expectation is that the market will likely be topping out shortly in all of wave (3) off the February 2016 lows, and providing us with a wave (4) pullback, with an ideal target in the 2300SPX region. While it is possible it may shorten and find support as high as 2360SPX (assuming it may trace out as a triangle), I fully expect to see a multi-month consolidation begin shortly. A strong break out over 2525SPX would make me re-evaluate this immediate potential.
See charts illustrating the wave counts on the S&P 500.
Avi Gilburt is a widely followed Elliott Wave technical analyst and author of ElliottWaveTrader.net (www.elliottwavetrader.net), a live Trading Room featuring his intraday market analysis (including emini S&P 500, metals, oil, USD & VXX), interactive member-analyst forum, and detailed library of Elliott Wave education.
© 2017 Copyright Avi Gilburt - All Rights Reserved Disclaimer: The above is a matter of opinion provided for general information purposes only and is not intended as investment advice. Information and analysis above are derived from sources and utilising methods believed to be reliable, but we cannot accept responsibility for any losses you may incur as a result of this analysis. Individuals should consult with their personal financial advisors.
© 2005-2022 http://www.MarketOracle.co.uk - The Market Oracle is a FREE Daily Financial Markets Analysis & Forecasting online publication.