


Crude Oil Price Invalidated Breakout – What’s next?
Commodities / Crude Oil Sep 12, 2017 - 03:13 PM GMTBy: Nadia_Simmons

 On Friday, crude oil moved sharply lower and lost over 3% after investors digested the EIA report and reacted to the increase in crude oil inventories. Thanks to these circumstances, light crude invalidated the earlier breakout above the resistance area and slipped well below $48. What does it mean for the commodity?
Crude Oil’s Technical Picture
Let’s take a closer look at the charts below (charts courtesy of http://stockcharts.com).
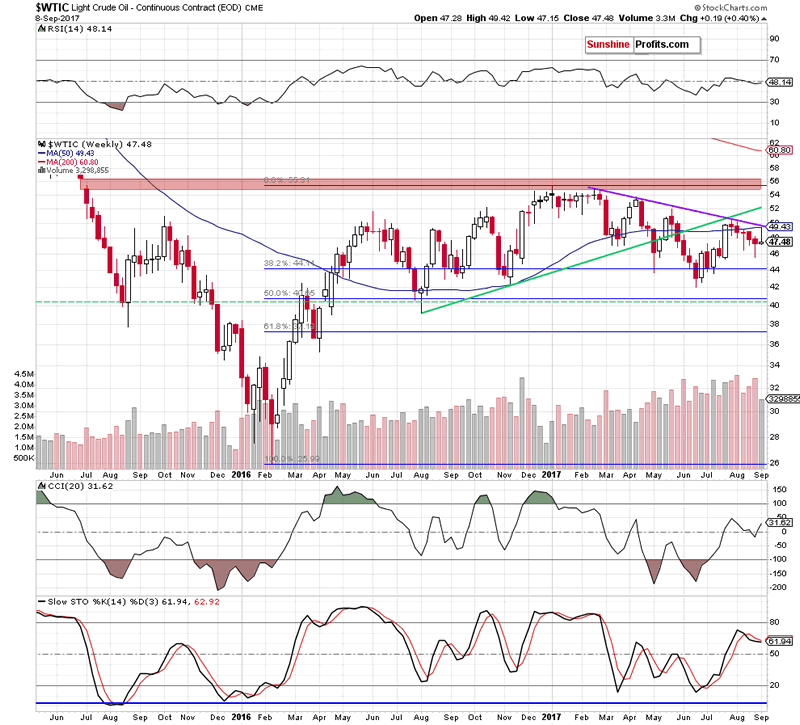
On Thursday, we wrote that crude oil extended gains, but did this increase change anything? In our opinion, it didn’t. Why? As you see on the weekly chart, despite Wednesday’s move, the black gold is still trading under the purple declining resistance line based on the previous highs and the 50-week moving average, which together were strong enough to stop oil bulls in the previous months.
Additionally, the commodity increased to two important lines: the orange resistance line based on the August highs and the previously-broken lower border of the purple rising trend channel, which increases the probability of reversal – especially when we factor in the size of yesterday’s volume. (…) Wednesday’s move materialized on visibly lower volume than Tuesday’s increase, which raises some doubts about oil bulls’ strength (similarly to what we saw in mid-August).
What’s next for light crude?
(…) if the commodity increases to the lower border of the purple rising trend channel and then reverses and declines, we will see another verification of the earlier breakdown under this short-term resistance, which will give oil bears a very important reason to act in the following days.
From today’s point of view, we see that the situation developed in line with the above scenario as crude oil reversed and declined sharply on Friday. Thanks to this drop light crude created a bearish candle on the weekly chart (visibly longer upper shadow suggests a turning point), which verified the earlier breakdown below the long-term purple declining resistance line (based on the February and April highs) and the 50-week moving average once again. Taking this bearish development into account and combining it with the sell signal generated by the weekly Stochastic Oscillator, we think that further deterioration is more likely than not.
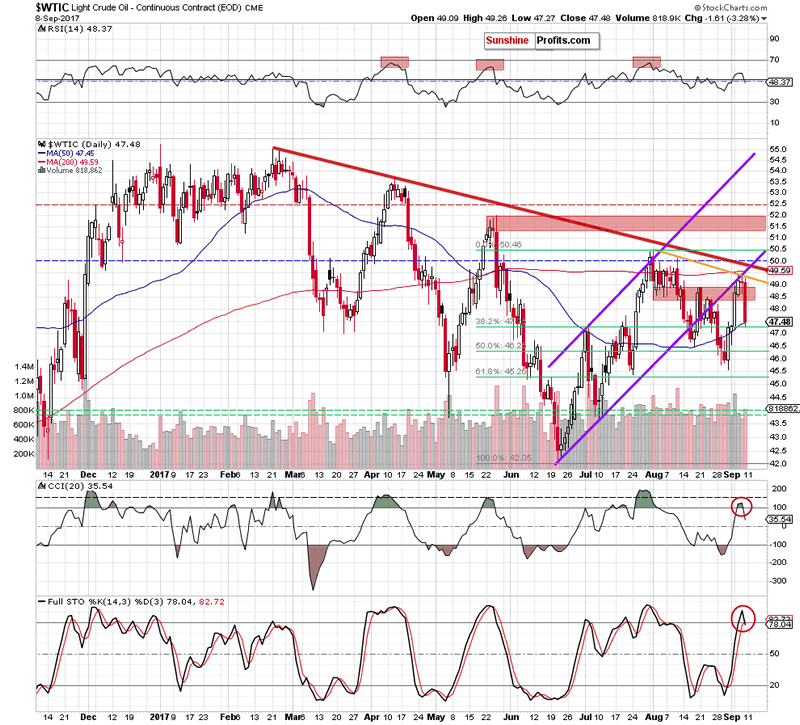
When we take a closer look at the daily chart, we can easily notice more bearish factors. As we assumed in our Thursday’s alert, crude oil reversed and declined after an increase to the lower border of the purple rising trend channel, which resulted in another verification of the earlier breakdown under this short-term resistance. Additionally, the commodity invalidated the earlier breakout above the red resistance zone and closed the day below it. On top of that, CCI and the Stochastic Oscillator generated the sell signals, supporting oil bears and further deterioration.
How low could the commodity go in the coming days?
In our opinion, if light crude declines under the Friday low of $47.27, the next downside target will the August low (around $45.58) or even the 61.8% Fibonacci retracement and the late July low (around $45.26-$45.40).
Summing up, profitable short positions continue to be justified from the risk/reward perspective as crude oil moved sharply lower after another verification of the breakdown below the medium-term purple declining resistance line based on the February and April highs, the 50-week moving average and the lower border of the purple rising trend channel. Additionally, the weekly Stochastic Oscillator and both daily indictors generated the sell signals, supporting further deterioration in the coming week.
If you enjoyed the above analysis and would like to receive free follow-ups, we encourage you to sign up for our daily newsletter – it’s free and if you don’t like it, you can unsubscribe with just 2 clicks. If you sign up today, you’ll also get 7 days of free access to our premium daily Oil Trading Alerts as well as Gold & Silver Trading Alerts. Sign up now.
Nadia Simmons
Forex & Oil Trading Strategist
Sunshine Profits: Gold & Silver, Forex, Bitcoin, Crude Oil & Stocks
Stay updated: sign up for our free mailing list today
* * * * *
Disclaimer
All essays, research and information found above represent analyses and opinions of Nadia Simmons and Sunshine Profits' associates only. As such, it may prove wrong and be a subject to change without notice. Opinions and analyses were based on data available to authors of respective essays at the time of writing. Although the information provided above is based on careful research and sources that are believed to be accurate, Nadia Simmons and his associates do not guarantee the accuracy or thoroughness of the data or information reported. The opinions published above are neither an offer nor a recommendation to purchase or sell any securities. Nadia Simmons is not a Registered Securities Advisor. By reading Nadia Simmons’ reports you fully agree that he will not be held responsible or liable for any decisions you make regarding any information provided in these reports. Investing, trading and speculation in any financial markets may involve high risk of loss. Nadia Simmons, Sunshine Profits' employees and affiliates as well as members of their families may have a short or long position in any securities, including those mentioned in any of the reports or essays, and may make additional purchases and/or sales of those securities without notice.
© 2005-2022 http://www.MarketOracle.co.uk - The Market Oracle is a FREE Daily Financial Markets Analysis & Forecasting online publication.