


GBP USD Approaches Fibonacci Target
Currencies / Forex Trading Sep 15, 2017 - 03:40 PM GMTBy: Enda_Glynn

 Good evening to you all.
Another day, another all time high in the DOW, and another step closer to the target zone.
The wave count is working well on this front,
And I am sure we will see a break above 22300's before long,
But what amazes' me everyday,
is the sheer lack of interest in questioning this now eight year long rally.
It is taken for granted like milk in the supermarket.
There is no way out of the corner we have worked ourselves into.
Other than a complete financial reset.
My Bias: short below parity in wave (5).
Wave Structure: continuing impulsive structure to the downside in wave (5)
Long term wave count: decline in wave (5) blue, below parity
Important risk events: GBP: MPC Member Vlieghe Speaks. USD: Retail Sales m/m, Empire State Manufacturing Index, Industrial Production m/m.
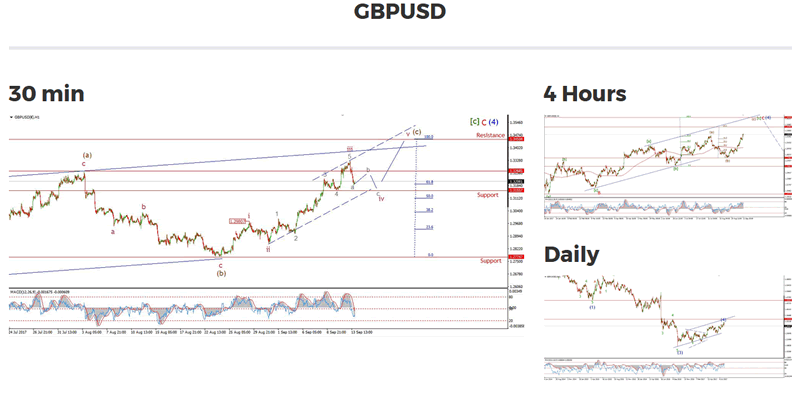
Cable reached the support at 1.3155 as suggested by last nights wave count.
The rally off that low was sharp,
And reached a high so far at 1.3404,
The target for wave 'v' pink was set at 1.3450
where wave (a) and wave (c) brown hit equality.
The price has broken over both rising trendlines in a throw-over top.
So from here it is time to start looking for a top to form again.
For tomorrow;
Watch For a reaction to the Fibonacci target at 1.3450.
I want to see an impulse move downwards and a corrective lower high from there.
My Bias: LONG
Wave Structure: rally in wave [C]
Long term wave count: wave [C] is underway, upside to above 136.00
Important risk events: JPY: N/A. USD: Retail Sales m/m, Empire State Manufacturing Index, Industrial Production m/m.
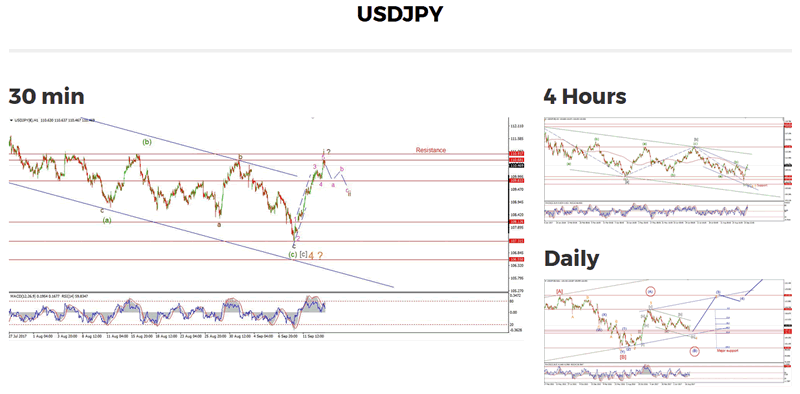
I have updated the wave count to show the rally as a higher degree wave (i) green.
The extended nature of the rally so far lends itself to this interpretation better.
The inevitable correction to follow will be viewed as wave (ii) green,
And should trace out three clear waves down.
The 50% retracement off the rally off the lows comes in at 108.79.
For tomorrow;
The decline this evening may have begun wave (ii) green.
initial support lies at 109.88, the previous 4th wave low.
Watch for wave 'a' to reach this support.
My Bias: market topping process ongoing
Wave Structure: Impulsive 5 wave structure, possibly topping in an all time high.
Long term wave count: Possibly topped in wave (5)
Important risk events: USD: Retail Sales m/m, Empire State Manufacturing Index, Industrial Production m/m.
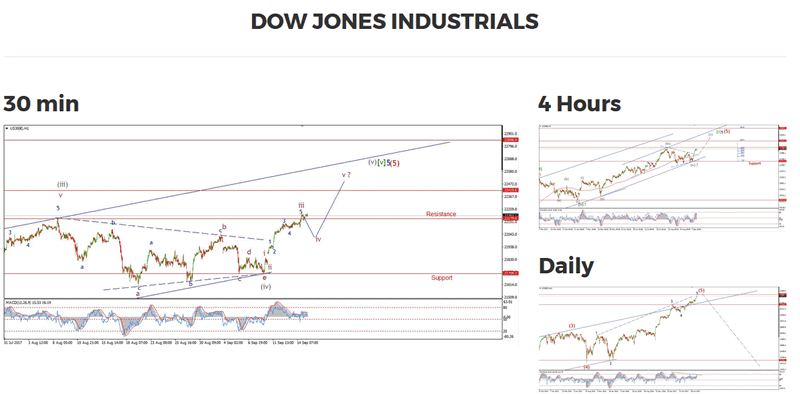
I have update the short term count in the DOW to show a rally at one degree higher
With an extension visible within wave 'iii' pink.
The break to a new all time high today has likely completed wave 'iii' and wave 'iv' pink should follow.
I have shown the two Fibonacci targets on at 22419 and 22850 on the short term chart.
The rising trendline would be hit somewhere in the center of these two targets in wave 'v' pink.
I suspect that wave 'iv' pink will begin tomorrow
And I dont expect much of a decline given the shallow declines so far in this wave.
for tomorrow;
Watch for a shallow decline to begin in wave 'iv' pink.
Wave 'v' will have to wait until next week to begin.
So next week is looking bullish right now.
My Bias: Long towards 1550
Wave Structure: ZigZag correction to the upside.
Long term wave count: Topping in wave (B) at 1550
Important risk events: USD: Retail Sales m/m, Empire State Manufacturing Index, Industrial Production m/m.
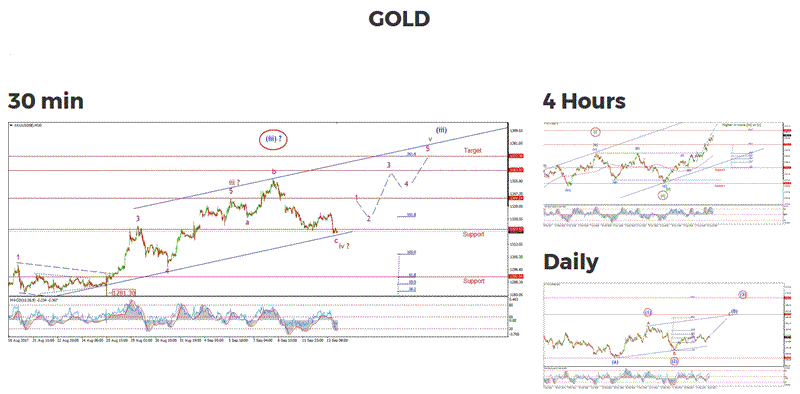
Despite a slight dip below support this morning,
GOLD has risen throughout the day and is about to close at the highs of the day.
It is reasonable to assume that wave 'v' brown has begun off the lows of the day.
The rise off the lows is likely wave '1' pink.
A break above the previous interim high at 1334.55 will add weight to the current wave count.
Enda Glynn
http://bullwaves.org
I am an Elliott wave trader,
I have studied and traded using Elliott wave analysis as the backbone of my approach to markets for the last 10 years.
I take a top down approach to market analysis
starting at the daily time frame all the way down to the 30 minute time frame.
© 2017 Copyright Enda Glynn - All Rights Reserved
Disclaimer: The above is a matter of opinion provided for general information purposes only and is not intended as investment advice. Information and analysis above are derived from sources and utilising methods believed to be reliable, but we cannot accept responsibility for any losses you may incur as a result of this analysis. Individuals should consult with their personal financial advisors.
© 2005-2022 http://www.MarketOracle.co.uk - The Market Oracle is a FREE Daily Financial Markets Analysis & Forecasting online publication.