


AUDUSD Broke Below Major Support Level At 0.7807
Currencies / Austrailia Oct 06, 2017 - 06:34 PM GMTBy: Franco_Shao

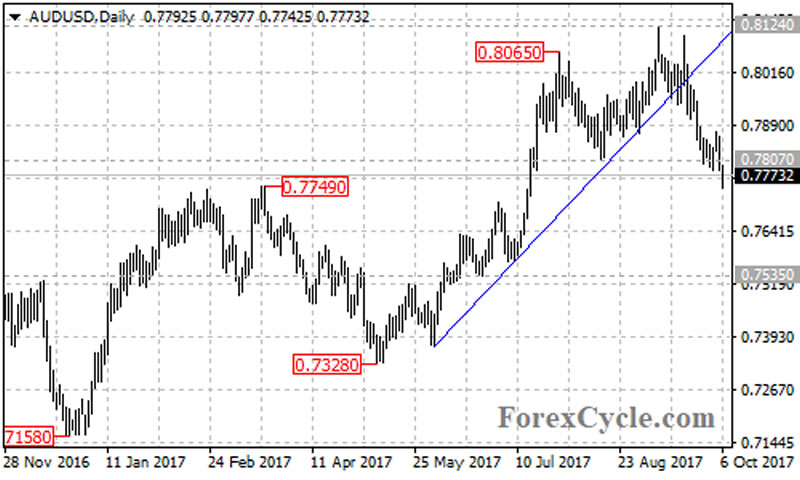
 After breaking below a bullish trend line on the daily chart, AUDUSD continued to break below an important support level at 0.7807 and extended its downside movement to as low as 0.7743, confirming that the bullish movement from 0.7328 had completed at 0.8124 already. Further decline would likely be seen over the next several weeks.
On the downside
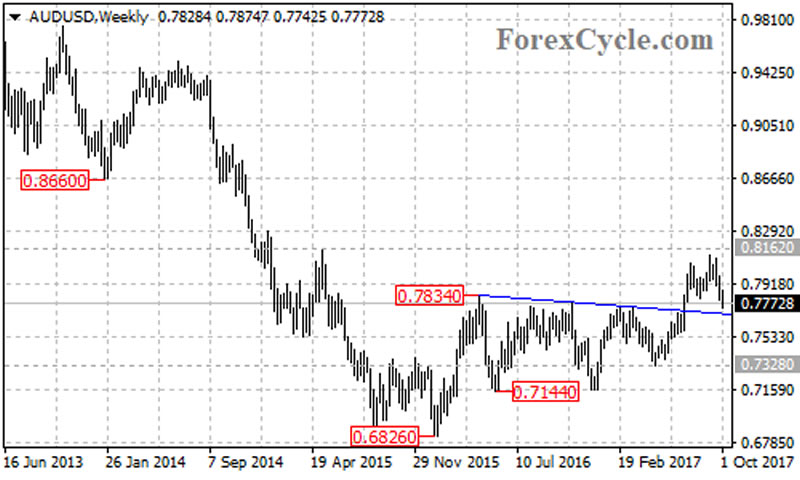
The AUDUSD pair is now facing the resistance-turned-support trend line on the weekly chart now at around 0.7700. A break through this trend line could bring price to next support level at 0.7535. Below this could trigger further downside move towards 0.7328.
On the upside
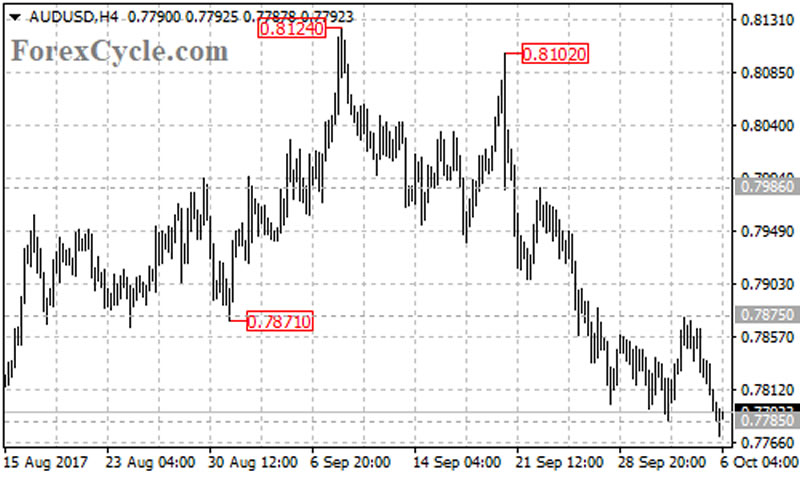
There is a key resistance located at 0.7875 on the 4-hour chart. As long as the price is below this level, the downside movement from 0.8124 could be expected to continue. However, a move through 0.7800 level could take price back to test 0.7875 key resistance. Above this level would indicate that the downtrend is complete, then the following correction rally could bring price back towards next resistance level at 0.7986.
For long term analysis
The AUDUSD pair failed to break out of 0.8162 resistance and pulled back from 0.8124. The resistance-turned-support trend line on the weekly chart could be treated as a key support for the upside movement from 0.6826. Move through the trend line would confirm that the whole upside movement had completed at 0.8124 already, then the following bearish movement could take price back towards 0.6826 previous low.
Technical levels
Support levels: 0.7700 (the resistance-turned-support trend line on the weekly chart), 0.7535 (the June 22 low), 0.7328 (the May 9 low), 0.7144 (the May 2016 low), 0.6826 (the January 2016 low).
Resistance levels: 0.7800 (near term resistance), 0.7875 (key resistance), 0.7986 (the September 22 high), 0.8124 (the September 8 high), 0.8162 (the May 2015 high).
This article is written by Franco Shao, a senior analyst at ForexCycle.
© 2017 Copyright Franco Shao - All Rights Reserved Disclaimer: The above is a matter of opinion provided for general information purposes only and is not intended as investment advice. Information and analysis above are derived from sources and utilising methods believed to be reliable, but we cannot accept responsibility for any losses you may incur as a result of this analysis. Individuals should consult with their personal financial advisors.
© 2005-2022 http://www.MarketOracle.co.uk - The Market Oracle is a FREE Daily Financial Markets Analysis & Forecasting online publication.