


EURGBP’s Correction Rebound Extended To 0.8992
Currencies / Euro Oct 09, 2017 - 03:18 PM GMTBy: Franco_Shao

 EURGBP extended its upside movement from 0.8746 to as high as 0.8992, breaking above a major resistance level at 0.8899, indicating that correction for the downtrend from 0.9306 is underway. Further rise is still possible in the coming days.
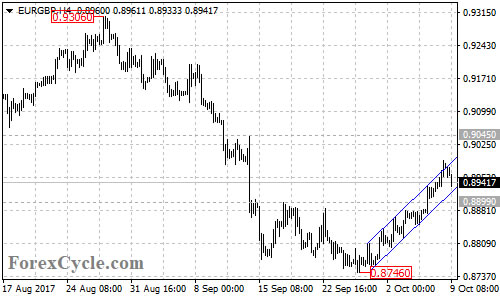
The EURGBP pair stays in a bullish price channel on its 4-hour chart. As long as the price is in the channel, the upside movement could be expected to continue and next target would be at 0.9045 resistance.
However, the bounce from 0.8746 would possibly be correction of the downtrend from 0.9306, another fall would likely be seen before breaking above 0.9045 resistance. Next term support is at the bottom trend line of the channel now at around 0.8920. Breakthrough the channel bottom could bring price back to the resistance-turned-support level at 0.8899.
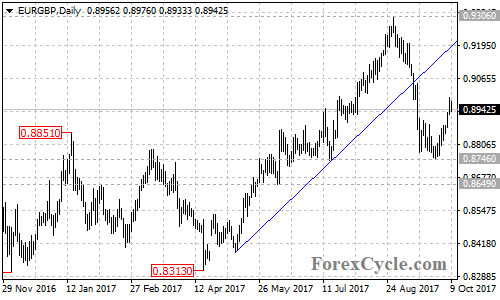
The 0.8899 level is treated as key support for the correction rebound, below if seen could trigger further bearish movement towards 0.8746. Below this level would confirm that the downtrend from 0.9306 has resumed, then next target would be at the 61.8% Fibonacci retracement taken from 0.8313 to 0.9306 at around 0.8690, followed by the 76.4% retracement at 0.8545.
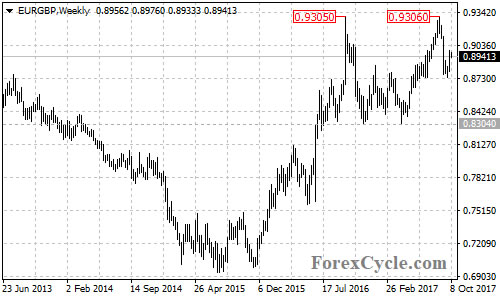
For, the EURGBP pair might be forming a double top pattern with neckline at 0.8304 on its weekly chart. A clear break below the neckline support could confirm the pattern, then the additional measured movement could take price to 0.7300 area.
Technical levels
Support levels: 0.8920 (the bottom trend line of the price channel on the 4-hour chart), 0.8899 (the key support), 0.8746 (the September 27 low), 0.8690 (the 61.8% Fibonacci retracement), 0.8545 (the 76.4% Fibonacci retracement), 0.8304 (the neckline of the double top pattern), 0.7300 (the measured move target).
Resistance levels: 0.9045 (the key resistance), 0.9306 (the August 29 high).
This article is written by Franco Shao, a senior analyst at ForexCycle.
© 2017 Copyright Franco Shao - All Rights Reserved Disclaimer: The above is a matter of opinion provided for general information purposes only and is not intended as investment advice. Information and analysis above are derived from sources and utilising methods believed to be reliable, but we cannot accept responsibility for any losses you may incur as a result of this analysis. Individuals should consult with their personal financial advisors.
© 2005-2022 http://www.MarketOracle.co.uk - The Market Oracle is a FREE Daily Financial Markets Analysis & Forecasting online publication.