


Elliott wave: Are the Stock Indices Ending 5 Waves or Not?
Stock-Markets / Stock Market 2017 Oct 26, 2017 - 04:03 PM GMT

 Elliott wave: The 5 waves advance
The Elliott wave Theory is a famous trading tool and is based in the idea that the Market advances in 5 waves and corrects in 3 waves. The Theory has some basic rules which are listed below
1) Wave 2 never retraces more than 100% of wave 1.
2) Wave 3 cannot be the shortest of the three impulse waves, namely waves 1, 3 and 5.
3) Wave 4 does not overlap with the price territory of wave 1, except in a diagonal formation.
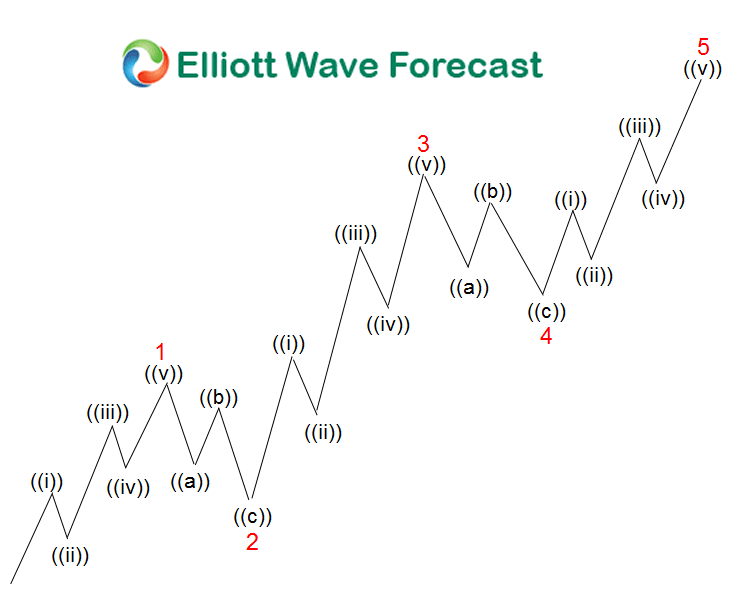
These rules are the ones which appear in a 5 waves advance but also the one that make traders around the globe to be misled into trading on wrong side of the Market. Many traders develop the habit to pick tops and trade into corrections when they see what looks like a 5 waves move and believe that a pullback or sell off is imminent. The reality is that those 3 rules are not enough and we have been saying for years that the Theory is too simple and too old to be used without any other tools. We have added several new rules or conditions to validate the Market and consequently gain an edge over the Market and the theory itself. In this blog, we will explain why the YM #F which is the Dow Jones Futures is being wrongly counted as a 5 waves move from 2 significant lows i.e. the 2009 cycle and the 2.2016 low cycle. We believe wave 5 in an advance needs to provided momentum divergence against the peak of wave 3 , otherwise the move is either corrective and ending a 3 waves advances or even more powerful when the market is still within the wave 3 with the waves 4 and 5 to come. Let’s now take a look at the charts below
YM#F Cycle from 2.2016 low: 5 Waves or not?
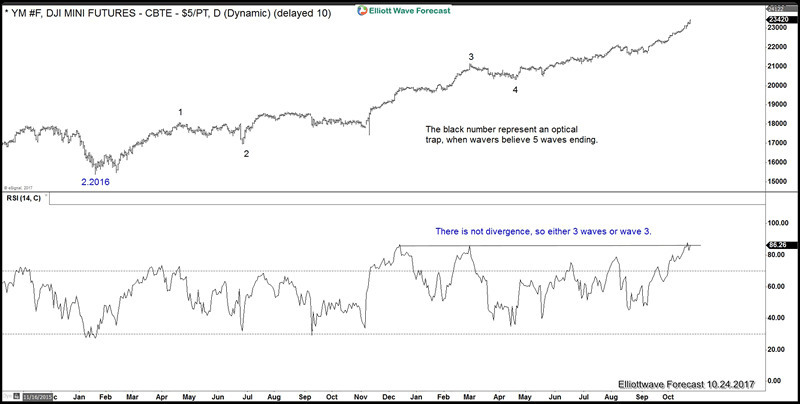
The Chart above is showing the cycle since 2.2016 low and if we look at RSI at the bottom of the chart, we can see that move from 8.2017 low has erased RSI divergence with respect to 3.2017 peak , in other words RSI is currently at the highest level since the move started from 2.2016 low so we are either ending the whole cycle as a 3 waves corrective sequence or still within wave 3 of a 5 waves advance.
YM#F Cycles from 2009 low (Price and RSI)
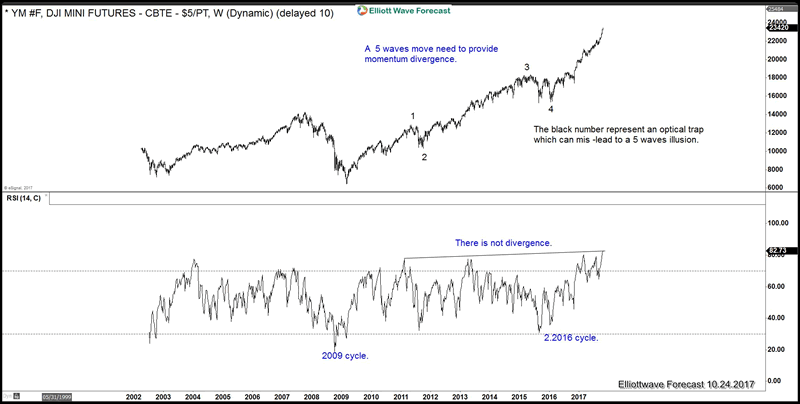
The Chart above is showing the cycle since lows at 2009 and we can see how the price have erased the divergence within the cycle and showing 5 swings, meaning it’s not a 5 waves advance. We can see how both cycles have erased divergence compared to the higher read within the cycle which mean that current rally is the peak in both degrees and more upside should happen in the long term cycles. The Market is a combinations of cycles and time frames and traders need to upgrade and downgrade the Instrument be able to provide a reliable forecast or wave count. We are always trying to help members and non-members to understand the Elliott wave Theory and applying it to according to the current times instead of following the theory in it’s original form which is too simple and without additional tools, doesn’t help to avoid falling into the traps laid out by the Market every day.
The Relative Strength Index (RSI), developed by J. Welles Wilder, is a momentum oscillator that measures the speed and change of price movements. The RSI oscillates between zero and 100, the instrument gather the strength of the move and we used every day in our charts and forecast, we always aid a wavers without the RSI won’t be able to get the desired results and today the proof is that, we are not ending a 5 waves move in the YM# F (Dow Jones). We are either ending wave 3 with 4 and 5 to come or we are ending a correcting advance since the lows at 2.2016. We do understand the optical view of the 5 waves advances but the RSI is denying the notion of 5 waves so it’s better to find a count which fit the criteria instead of forcing and eventually falling into the trap.
The cycle from 2.2016 can end soon and provide a pullback and another chance to buy, but if the pullback happens without a 4-5, then the structure will become corrective from 2009 and 2016 cycle. We offer a 14 Days Trial at https://elliottwave-forecast.com/ and we teach new ideas, rules and techniques every day to members to make them better traders.
By Ayoub Ben Rejeb
https://elliottwave-forecast.com
ElliottWave-Forecast has built its reputation on accurate technical analysis and a winning attitude. By successfully incorporating the Elliott Wave Theory with Market Correlation, Cycles, Proprietary Pivot System, we provide precise forecasts with up-to-date analysis for 52 instruments including Forex majors & crosses, Commodities and a number of Equity Indices from around the World. Our clients also have immediate access to our proprietary Actionable Trade Setups, Market Overview, 1 Hour, 4 Hour, Daily & Weekly Wave Counts. Weekend Webinar, Live Screen Sharing Sessions, Daily Technical Videos, Elliott Wave Setup .
Copyright © 2017 ElliottWave-Forecast - All Rights Reserved Disclaimer: The above is a matter of opinion provided for general information purposes only and is not intended as investment advice. Information and analysis above are derived from sources and utilising methods believed to be reliable, but we cannot accept responsibility for any losses you may incur as a result of this analysis. Individuals should consult with their personal financial advisors.
© 2005-2022 http://www.MarketOracle.co.uk - The Market Oracle is a FREE Daily Financial Markets Analysis & Forecasting online publication.