


Precious Metals Blastoff About To Happen
Commodities / Gold and Silver 2017 Nov 06, 2017 - 06:29 AM GMTBy: Chris_Vermeulen

 If you’ve followed our analysis long enough, you’ll understand that we have been bullish yet cautious of this market move. Our research team at ActiveTradingPartners.com has been warning our members of the potential for a volatile and possibly viscous retracement in the US majors for weeks. We understand that capital, as a source that requires ROI and degrees of certainty, is moving into US equities at an incredible pace and that the last 8+ months fantastic moves in the US markets are related to expectations of greater economic activities related to President Trump and new policies. Yet, we also understand that the markets just don’t up straight up forever and that capital, once risk is evident, will find other sources of ROI should the globe or the US become more volatile. Hence, our position that “Risk” is relatively high at the moment for any unexpected retracements.
Our research team has been focused on primarily four components of the market with regards to factoring in Risk. Before we get into what these four components are and why we are paying close attention to them, lets take a few minutes to understand the “setup” and what we believe will be the result.
The “Setup” is that bullish trending should likely continue in the US Majors until something dramatic and unexpected derails this move. Volatile retracements in the range of 2~4% should not be unexpected. Any move like we’ve seen over the past 8 months where price enters a nearly parabolic uptrend should restore some normalcy with moderate price retracements. This is the nature of price – it rotates attempting to identify key support and resistance levels. Global capital is rushing into the US markets as other markets languish and the new Trump presidency offers a glimmering opportunity for capital to gain ROI within the US. This is why, we believe, the US markets have moved so strongly over the past 8+ months.
Now that we understand the “Setup”, lets review the current market environment. Given the recent news of political turmoil in DC and the foreign news of a faster Brexit, China’s potential slowing and variances in global economies that were not expected, we have been paying attention to those four key components trying to identify early signs of weakness or rotation to alert our members. What are they?
_Metals
_Transportation
_Healthcare
_Technology
Why these components? We’ve selected these components because they translate to core components of the US and global economies as well as key indicators of consumer spending and consumption. The Metals and Transportation sectors show us how fear and greed are playing out in the markets (wheras Transportation typically leads the markets by 2~4 months as an indication of economic demand and freight activities). The metals markets are the clearest signs of fear entering the markets as prices climb.
Technology and Healthcare are two key components of the US and global economy as they drive a very large portion of the US economic activity and nearly everything related to retail, commerce and/or transactional economics is in some way related to Technology or Healthcare.
Now, onto the charts…
In the past, we have been warning of a massive move higher in the metals that we’ve been following and waiting for. Our prediction is based on a number of factors; Elliot Wave Anlaysis, Technical Analysis, Fibonacci Analysis and much more. We’ve included a few recent charts to show you how and why we believe this move higher is Gold and Silver will coincide with a broader general market retracement in the US majors (and possibly include the global markets).
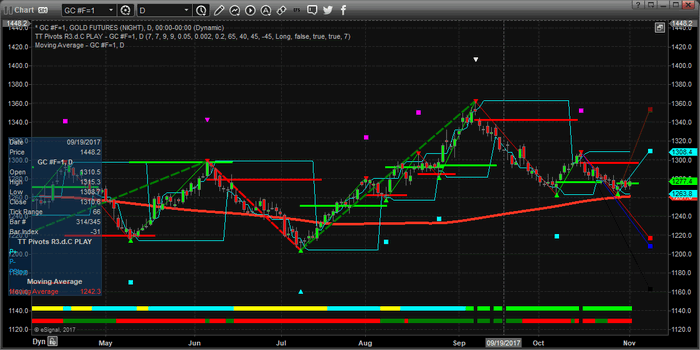
You will likely see from this Gold Daily Fibonacci Price Modeling chart that the recent price rotation in Gold has setup a nearly perfect double bottom as well as a recent bullish price trigger as price moved above the GREEN LINE level. This move is setting up to allow a price advance back to near $1350 with key support currently being near $1260. This current rotation on the Daily chart is indicating that price could find some resistance near $1310 as it moves higher.
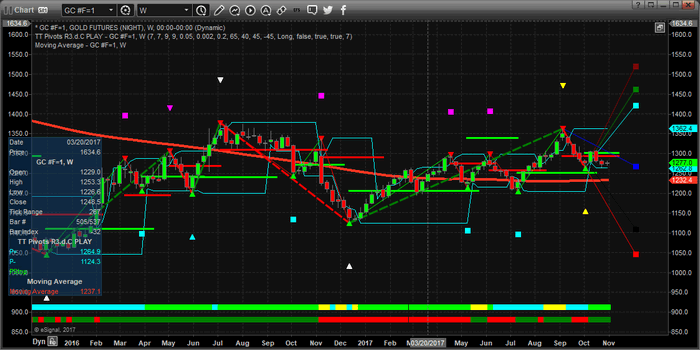
This Weekly Gold Fibonacci Price Modeling chart shows a very interesting price setup. Current, we do not see the bullish trigger on this chart as we do on the Daily chart. We do see support near $1260 being identified and we also see upside targets of $1420, $1460 & $1525 being identified. These are all contingent on Gold moving higher above $1300 to generate a bullish Fibonacci price trigger.
Should the Daily price swing/trigger continue higher, this Weekly trigger could happen within the next few trading days. So pay attention.
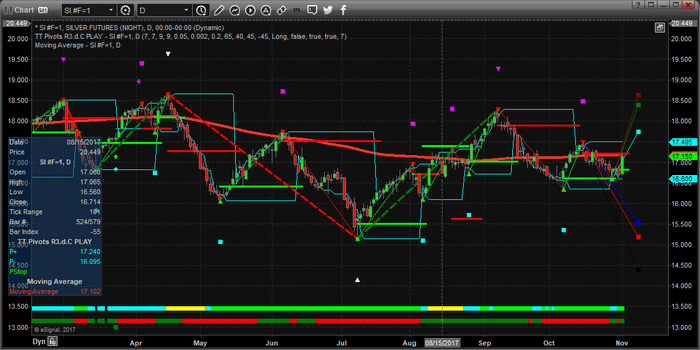
Silver is on the move as well. This Daily Silver Fibonacci Modeling Price chart is similar to the Gold Daily chart, yet it clearly shows the recent move, today, in Silver that generated a strong BUY trigger with support near $16.25 and targets near $17.75, $18.45 & $18.60. As long as Silver stays above the $16.25~16.40 level, it should attempt to expand higher over the next few weeks/months.
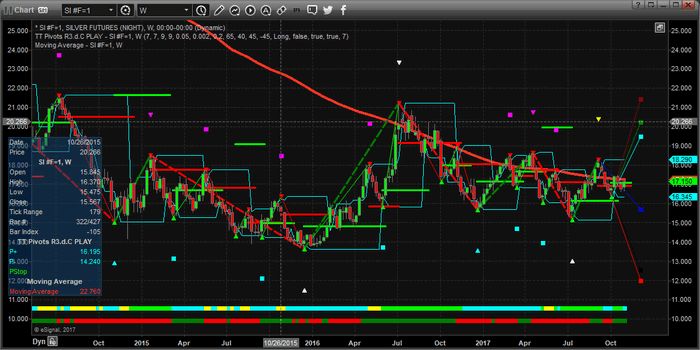
This Weekly Silver Fibonacci Price Modeling chart provides a larger view of what to expect with Silver. The current move is rather contained in comparison to the other price activity on this chart. Yet, take a look at the expansion ranges to the upside and the fact that today price action confirmed the upside (BUY) trigger. The upside targets are $19.50, $20.25 & 21.50.
Should the metals run higher to near these projected target levels, then we can assume that the US majors will find some resistance and trail off a bit with moderate volatility. The Transportation index has begun to rollover a bit and the Biotech/Healthcare sector has been under pressure for a little over two weeks.
We believe this move in the metals markets will continue to solidify over the next few weeks before any explosive moves really begin. So, if you are involved in the markets or like to trade the metals, you should visit ActiveTradingPartners.com to check out our most recent analysis and triggers. We’ll continue to advise our clients with regards to these setups and extended moves and we urge you to take advantage of our specialized price modeling systems.
These moves could be explosive and we want to assist you in profiting from them with our advanced research and technology. Check out www.ActiveTradingPartners.com today to learn more.
Chris Vermeulen
www.TheGoldAndOilGuy.com – Daily Market Forecast Video & ETFs
www.ActiveTradingPartners.com – Stock & 3x ETFs
Chris Vermeulen is Founder of the popular trading site TheGoldAndOilGuy.com. There he shares his highly successful, low-risk trading method. For 7 years Chris has been a leader in teaching others to skillfully trade in gold, oil, and silver in both bull and bear markets. Subscribers to his service depend on Chris' uniquely consistent investment opportunities that carry exceptionally low risk and high return.
Disclaimer: Nothing in this report should be construed as a solicitation to buy or sell any securities mentioned. Technical Traders Ltd., its owners and the author of this report are not registered broker-dealers or financial advisors. Before investing in any securities, you should consult with your financial advisor and a registered broker-dealer. Never make an investment based solely on what you read in an online or printed report, including this report, especially if the investment involves a small, thinly-traded company that isn’t well known. Technical Traders Ltd. and the author of this report has been paid by Cardiff Energy Corp. In addition, the author owns shares of Cardiff Energy Corp. and would also benefit from volume and price appreciation of its stock. The information provided here within should not be construed as a financial analysis but rather as an advertisement. The author’s views and opinions regarding the companies featured in reports are his own views and are based on information that he has researched independently and has received, which the author assumes to be reliable. Technical Traders Ltd. and the author of this report do not guarantee the accuracy, completeness, or usefulness of any content of this report, nor its fitness for any particular purpose. Lastly, the author does not guarantee that any of the companies mentioned in the reports will perform as expected, and any comparisons made to other companies may not be valid or come into effect.
Chris Vermeulen Archive |
© 2005-2022 http://www.MarketOracle.co.uk - The Market Oracle is a FREE Daily Financial Markets Analysis & Forecasting online publication.