


Perspective on the Gold/Oil Ratio, Macro Fundamentals and a Gold Sector Bottom
Commodities / Gold and Silver 2017 Nov 18, 2017 - 03:49 PM GMTBy: Gary_Tanashian

 This was going to be part of an NFTRH update, but I decided to make it public, as we’ll have plenty of other information to work on this weekend in NFTRH 474 after such an eventful market week.
With all due caveats about the non-stellar gold CoT data (we’ll update in #474) I wanted to note a constructive situation in gold vs. oil, which is a key sector fundamental consideration. Now, there is still a constructive situation in play for nominal crude oil, so take this post for perspective more than anything.
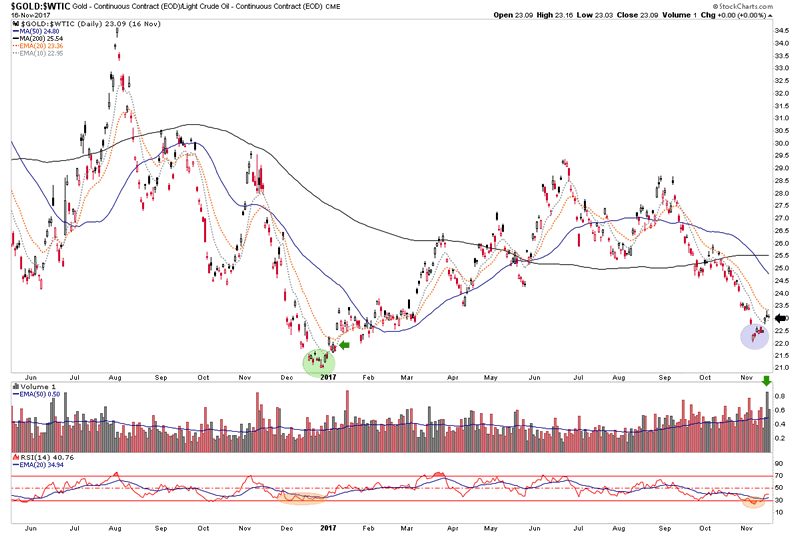
Pardon the massive charts (click to expand) but I am going to start using these personally so that I can fully take into account the historical market aspects that go further back on a daily chart. They just don’t present as well at the website, unless clicked. So I’ll mostly use the smaller, clearer charts for public consumption.
Au/WTI bottomed in December of 2016 as the sector bottomed that same month. The first positive signal was a rise above the daily EMA 10. That is what Au/WTI did this week (until today, as it pulls back below the EMA 10, in-day). Pullbacks will happen even if this is a successful bottoming process. The relative downside volume into an oversold RSI (14) and even higher upside relative volume out of the oversold reading is interesting.
Here is a longer-term view showing that situation, which came in tandem with only a moderate rally in HUI (shaded in the background) that failed, seemingly on schedule (to our indicators at the time) this past summer. But this chart dials back to before the key January 2016 time frame when HUI put in a low that preceded the impulsive bull leg in the first half of 2016.
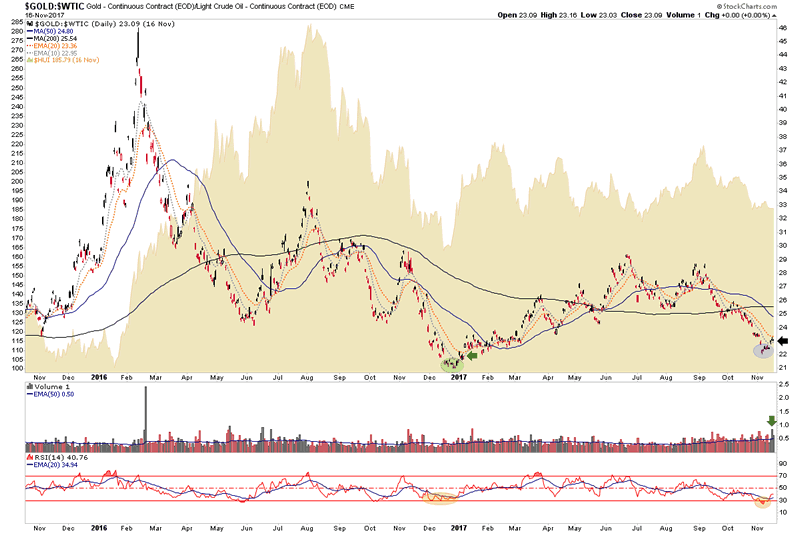
There is talk among certain TA practitioners that fundamentals don’t matter in this sector. I assure you, they do. The bottom in early 2016 came in tandem with a rapidly improving gold/oil sector fundamental. Other macro fundamentals soon followed and it was off on what may well one day prove to have been the first move to a new bull market in gold stocks.
But look at how the rally took place against a gold/oil ratio that had topped, reversed and dropped hard. If you recall silver was leading and a greater risk ‘on’ inflation trade (including commodities and stock markets) was getting a shot in the arm at that time. That is when inflation-fixated gold bugs tout and lead the sheep astray. We noted danger at the time with this and other posts…
AMAT Chirps, B2B Ramps, Yellen Hawks and Gold’s Fundamentals Erode
Gold/Oil was just one of several bearish markers developing. So if we are going to use fundamentals to warn of danger, we are also going to be aware of them when scouting bullish opportunity. The charts above are only meant for perspective in looking at one indicator to see what would be needed to switch to a bullish orientation. Just as an up sector was vulnerable to a negative reversal in fundamentals, a down sector is a candidate to go up on a positive reversal in the fundamentals.
This is just one sector fundamental consideration and there is a Macrocosm of macro fundamentals for consideration.
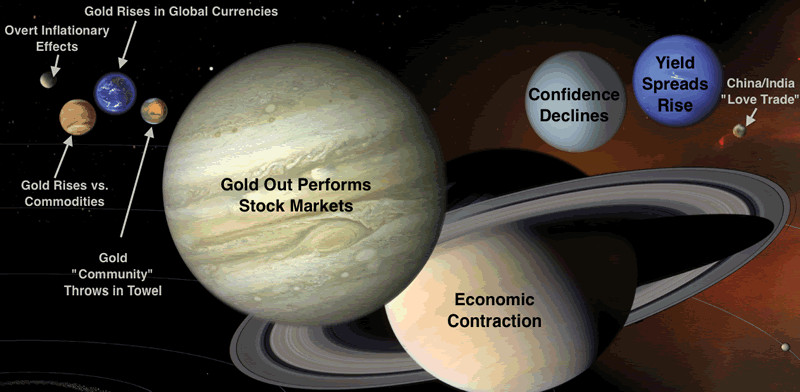
The largest planets have not come into play yet. Gold is drubbed vs. stocks, the economy is doing fine and by extension, so is public confidence. Add to that the still-flattening yield curve and the gold sector is not indicated to be ready yet.
Using gold vs. the stock market as an example however, you can see how this macro fundamental was very bearish across the board as the sector bottomed in January of 2016. But the Gold/Oil ratio had already turned up in December of 2015. This begs an ongoing view of several indicators on various time frames in an ongoing manner.
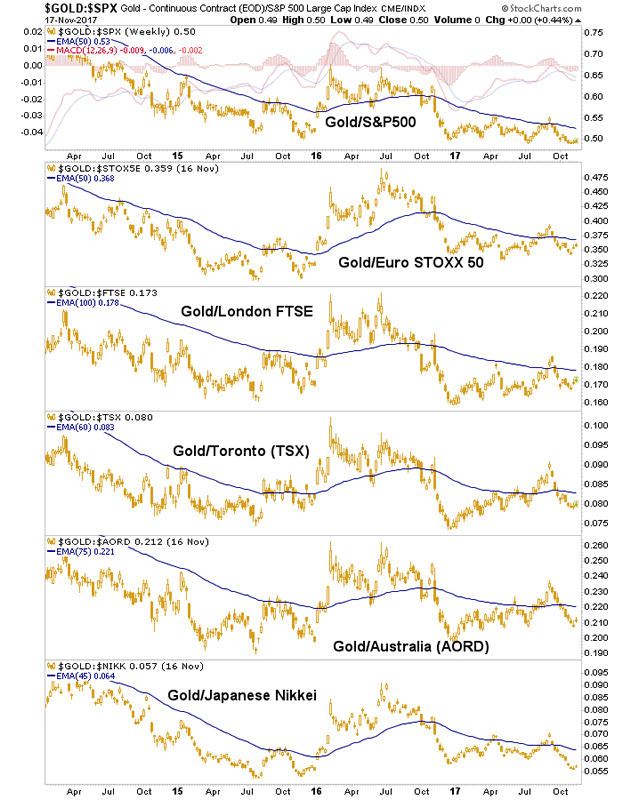
And that is exactly what we do in NFTRH. We cannot bend markets to our wills, but we sure can remain on alert for a range of signals in order to hone probabilities and risk vs. reward scenarios. Now that risk is easing and we are in the seasonally projected bottoming window of December/January we will once again be charting individual miners and royalties to go with ongoing coverage of the fundamentals and technicals. Patience folks, it’ll reward you.
Subscribe to NFTRH Premium for your 40-55 page weekly report, interim updates and NFTRH+ chart and trade ideas or the free eLetter for an introduction to our work. Or simply keep up to date with plenty of public content at NFTRH.com and Biiwii.com. Also, you can follow via Twitter ;@BiiwiiNFTRH, StockTwits, RSS or sign up to receive posts directly by email (right sidebar).
By Gary Tanashian
© 2017 Copyright Gary Tanashian - All Rights Reserved
Disclaimer: The above is a matter of opinion provided for general information purposes only and is not intended as investment advice. Information and analysis above are derived from sources and utilising methods believed to be reliable, but we cannot accept responsibility for any losses you may incur as a result of this analysis. Individuals should consult with their personal financial advisors.
Gary Tanashian Archive |
© 2005-2022 http://www.MarketOracle.co.uk - The Market Oracle is a FREE Daily Financial Markets Analysis & Forecasting online publication.