


Gold – Technical Obfuscation, Fundamentals, Predictions
Commodities / Gold and Silver 2018 Dec 18, 2017 - 10:49 AM GMTBy: Kelsey_Williams

 It is pretty much expected today that any investment analysis with justifiable conclusions will be steeped in technical study that includes lots of charts.
This seems especially true of gold.
Which is all well and good, I suppose; except for the obfuscation:
Obfuscation is the obscuring of the intended meaning of communication by making the message difficult to understand, usually with confusing and ambiguous language. The obfuscation might be either unintentional or intentional (although intent usually is connoted), and is accomplished with circumlocution (talking around the subject), the use of jargon (technical language of a profession), and the use of an argot (ingroup language) of limited communicative value to outsiders.[1]
Some of the obfuscation is understandable. For example, there are issues of legal liability for writers and analysts who are dispensing ‘investment’ advice. Therefore, open-ended interpretations can be useful – and protective.
And, if you have paid subscribers, you need to provide a noteworthy amount of (mis)information to justify the subscription price.
Other than that, the obsession with charts and technical analysis, and their byproduct of obfuscation (intended or not), has confused most people.
Most people are not short-term traders. Most people are not traders at all. And it is unlikely that they will gain a better understanding of gold. This is because there is a lack of accurate explanations regarding gold’s fundamentals .
Where can a clear explanation of gold’s fundamentals be found?
Aside from these concerns, there are times when charts can be useful.
For example, ifyou have a clear and accurate understanding of the fundamentals, and even if you are a long-term investor, you might use chart patterns of price action to provide possible entry and exit points.
The more trade-oriented you are, and the more short-term your objectives, then the more critical are your purchase and sale points. Hence, you would want to pay closer attention to the technical factors.
Again, this is appropriate ifyou have a good understanding of the fundamentals first. But your margin for error on a short-term basis is minimal and your chances of success are much less because of it.
There are traders and investment advisors who do not have a clear and accurate understanding of fundamentals. And they openly tout their ability to trade gold on a purely technical basis. If you are one of them, or taking advice from one of them, good luck!
A few words about the fundamentals of gold…
Gold is real money. It is not an investment. Its price is determined by changes in the value (either real or perceived) of the U.S. dollar.
The U.S. dollar is in a constant state of deterioration which leads to ever-higher prices for gold – over time. The decline in value of the U.S. dollar is punctuated with periods of relative stability. Periods of relative strength and stability in the U.S. dollar are reflected directly in a temporarily lower U.S. dollar price for gold.
With all of this in mind, here is a chart for your consideration:
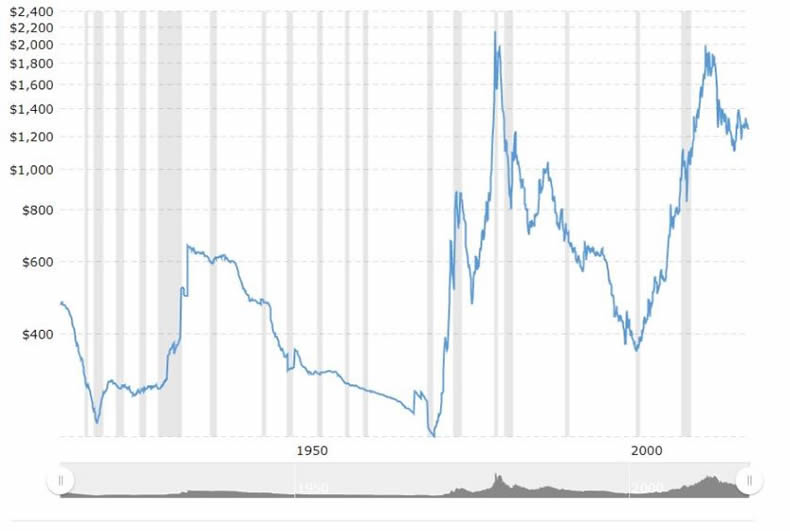
What you are seeing is a 100-year history of gold prices, inflation-adjusted and plotted on logarithmic scale.
There are several things we can learn from this chart.
First, gold did not make a new high in 2011 on an inflation-adjusted basis.
Second, it appears that gold prices might be in the early stages of a multi-year decline.
Third, gold’s price is nothing more than a reflection of changes in the value of the U.S. dollar.
Gold’s failure to make a new, inflation-adjusted high in 2011 is perfectly reasonable. This is because gold’s upward price movement reflected the extent of ongoing U.S. dollar devaluation that had occurred since the eighties. Whereas, the price movement upward in the seventies reflected U.S dollar devaluation that had occurred over the prior forty years – a period more than twice as long.
Also, the huge upward movement in gold’s price in the seventies came after an extended period of artificially low ‘official’ prices for gold and was triggered by the United States government’s refusal to honor its long-standing claim of international convertibility (into gold) for the U.S. dollar. So, there was a greater fundamental gap between the overvalued U.S dollar and the price of gold.
In addition, the markets were not as free and open as they are now, and ownership was restricted.
There is no fundamental reason for gold to make new inflation-adjusted highs.
That is because gold’s value does not change. Its value is constant. Gold is a store of value – not an investment. It is real money; and its price is a direct reflection of the changing value of the U.S. dollar.
After its peak in 1980, it took over twenty years for gold’s price to reach a bottom in 2001. In absolute terms it dropped in price by seventy percent. In inflation-adjusted terms, the drop was closer to eighty-five percent. Anything reasonably similar to that could take gold as low as $600.00 per ounce over the next ten to twelve years. (see chart)
There are six (1920, 1934, 1971, 1980, 2001, 2011) major turning points on the chart. All of them coincided with – and reflect – inversely correlated turning points in the value of the U.S. dollar.
For example, during the 1930s the price of gold on an inflation-adjusted basis declined as a result of the deflation that occurred. After that, it took several decades for the inflationary effects of the government’s money creation to be felt, such that gold’s price continued to decline as the dollar continued to gain in value.
When President Nixon suspended international convertibility of the U.S. dollar in 1971, gold’s price began a long-overdue move upward. At the same time, the U.S. dollar began a long move downward. In January 1980, both gold and the U.S dollar reversed direction. The strength in the U.S. dollar continued for twenty years, and gold’s price reflected that strength by declining in corresponding fashion. The cycle repeated itself in 2001 and 2011.
We are currently almost seven years into a period of relative strength in the value of the U.S. dollar. The next turning point will only happen when the current U.S. dollar strength runs out. A new period of sustained dollar weakness will be reflected in higher gold prices.
(read more about gold and the U.S. dollar)
By Kelsey Williams
http://www.kelseywilliamsgold.com
Kelsey Williams is a retired financial professional living in Southern Utah. His website, Kelsey’s Gold Facts, contains self-authored articles written for the purpose of educating others about Gold within an historical context.
© 2017 Copyright Kelsey Williams - All Rights Reserved Disclaimer: The above is a matter of opinion provided for general information purposes only and is not intended as investment advice. Information and analysis above are derived from sources and utilising methods believed to be reliable, but we cannot accept responsibility for any losses you may incur as a result of this analysis. Individuals should consult with their personal financial advisors.
© 2005-2022 http://www.MarketOracle.co.uk - The Market Oracle is a FREE Daily Financial Markets Analysis & Forecasting online publication.