


When One Pattern Ends, Another Begins
Stock-Markets / Stock Markets 2018 Mar 07, 2018 - 07:30 AM GMTBy: EWI

Learn what really governs the trend of interest rates
By Monday, Feb. 26, the stock market rally that carried major indexes out of the depths of the recent sell-off came to within 1000 points or so of the DJIA's Jan. 26 all-time high of 26,616.
The next day, on Feb. 27, a major financial publication published this headline (Forbes):
U.S. Stock Market Surge - 'The Bull Market Is Back'
Throughout the rally, many other observers expressed the view that the uptrend was back on track.
In stark contrast, after the close on Feb. 26, with the DJIA near 25,700, our Short Term Update showed subscribers this chart and said:
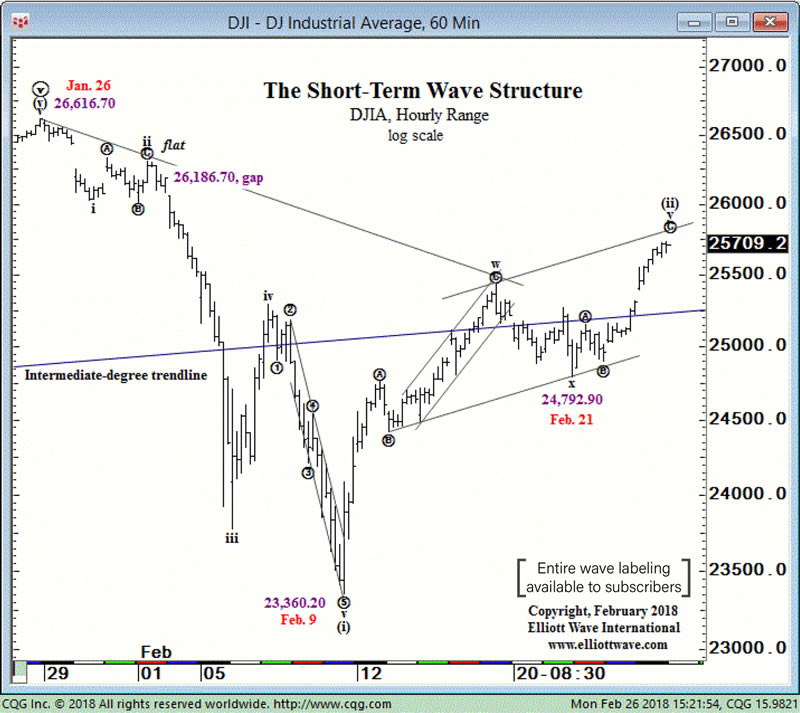
The DJIA gapped higher at today's open for the third straight day, carrying to 25,690.60 intraday. The index has carried into resistance at 25,520-25,920 (2763-2800 in the S&P) and the subwaves of the rise appear complete or nearly so.
As you know, the very next day, the DJIA closed down nearly 300 points, and since then, the volatility to the downside has persisted. (As I am writing this on Thursday, March 1, a CNBC headline says, "Dow plunges as much as 586 points...")
Not all Elliott wave forecasts work out like this. Still, what you gain from looking at the market through the Elliott wave prism is a roadmap of sorts. When you can count one price pattern as complete, you know what pattern should come next. That's how on February 26, our Short Term Update editor knew that the rally off the recent lows was on its last leg. Next, the wave pattern called for a reversal.
This is quite in contrast with many other market opinions you hear. A Feb. 26 Wall Street Journal article described it this way:
How Do Pundits Never Get It Wrong? Call a 40% Chance
Talking heads have learned that forecast covers all outcomes ...
Say there is a 40% chance of a market going up or down, and you'll be "right" either way.
The Elliott wave model employs strict rules and guidelines. And at this market juncture, the implications of what it's revealing are huge.
If you are prepared to take the next step in educating yourself about the basics of the Wave Principle -- access the FREE Online Tutorial from Elliott Wave International.
The Elliott Wave Basic Tutorial is a 10-lesson comprehensive online course with the same content you'd receive in a formal training class -- but you can learn at your own pace and review the material as many times as you like!
Get 10 FREE Lessons on The Elliott Wave Principle that Will Change the Way You Invest Forever.
This article was syndicated by Elliott Wave International and was originally published under the headline When One Pattern Ends, Another Begins. EWI is the world's largest market forecasting firm. Its staff of full-time analysts led by Chartered Market Technician Robert Prechter provides 24-hour-a-day market analysis to institutional and private investors around the world.
© 2005-2022 http://www.MarketOracle.co.uk - The Market Oracle is a FREE Daily Financial Markets Analysis & Forecasting online publication.