


Stock Market Retest of the Low?
Stock-Markets / Stock Markets 2018 Apr 09, 2018 - 09:39 AM GMTBy: Andre_Gratian

 Current Position of the Market
SPX: Long-term trend – The bull market is continuing with a top expected in the low 3000s.
Intermediate trend – The intermediate correction from 2873 should now continue until May.
Analysis of the short-term trend is done on a daily basis with the help of hourly charts. It is an important adjunct to the analysis of daily and weekly charts which discusses the course of longer market trends.
Daily market analysis of the short term trend is reserved for subscribers. If you would like to sign up for a FREE 4-week trial period of daily comments, please let me know at ajg@cybertrails.com
A Retest of the Low?
Market Overview
Conditions appear to be favorable for a re-test of the low in about a week. A cluster of cycles due to bottom in that time frame should bring about enough downside pressure to extend the decline which started on Friday. The Point & Figure chart pattern can also be interpreted as capable of projecting a move down to the 2560 level.
This move should complete this phase of the correction, but not the entire correction, which is unlikely to be over until the 40-week cycle makes its low in May. We should also be prepared for SPX to make new lows in that time frame. At least, this is what the congestion that took place at the 2750 level suggests.
After that, the bulls should regain control long enough to attempt making a new all-time high before conditions begin to favor the bears, once again, as we enter the fourth quarter of the year. We’ll discuss that when the time is right. For now, the market action over the next couple of days should let us know if our anticipated scenario for the rest of the week will turn out to be correct.
Since bottoming cycles are usually accompanied by a news background which is used to justify the market’s action, it would not be surprising if China sees Trump, and raises him another increase in tariffs over the next few days.
Chart Analysis (These charts and subsequent ones courtesy of QCharts)
SPX daily chart
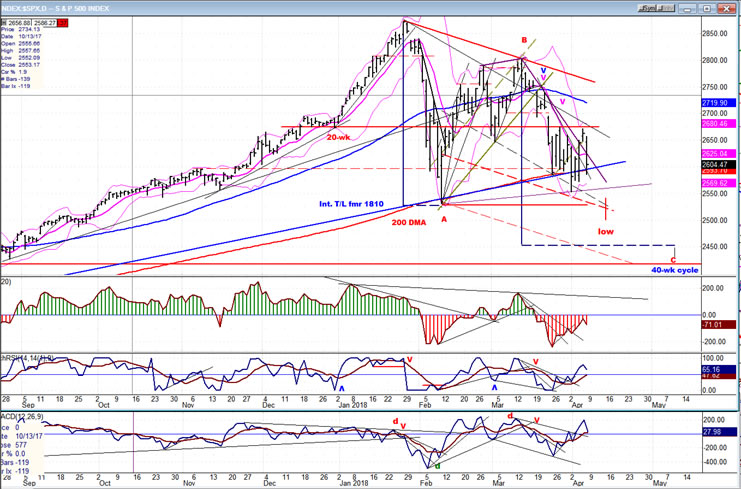
At this point, the 200-DMA and the intermediate trend line from the 1810 low have merged into one and are indistinguishable from each other. After making several attempts to breach the combined support they created, the bears finally succeeded last Monday -- but only for a brief moment. The index immediately jumped back above the support level and rose 120 points before falling like a brick again on Friday losing more than half of that gain. If the index traces out the prescribed scenario over the next week and reverses, we should have a pretty good idea of what kind of rebound to expect before the correction resumes and comes to an end at point C.
Last Monday’s drop caused the oscillators to become oversold. They have since rallied and the two lower ones even turned positive, but the upper one could not. Unless there is another near-term debacle of larger proportion than anticipated, the next low in the index should cause strong positive divergence. This would ensure that a good (but limited) rally will materialize the next time a reversal occurs.
SPX hourly chart
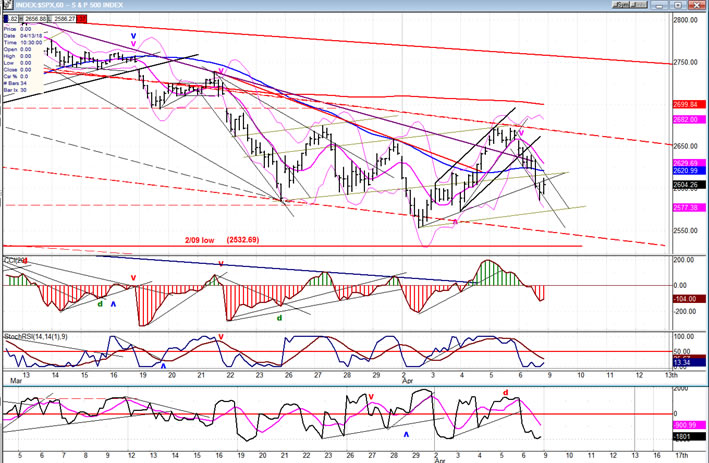
The last stages of this phase of the correction appear to be taking place between the two (dashed) parallels to the primary (red) downtrend line at the top of the chart. If the scenario which I propose is correct, this pattern may continue until the end of the week, after which we should reverse and rally, but fall short of that red trend line.
Since there is no deceleration in the near-term declining price pattern, nor is there any significant divergence showing in the oscillators, we could make a slightly lower low on Monday before rebounding a few points over the next couple of days. This would be the ideal action to refine the P&F formation targeting a move down to the previous low of 2554. After that, a final low would probably create some positive divergence in the hourly oscillators as well as in the daily, suggesting that a good reversal is about to take place.
DJIA vs. TRAN (wkly)
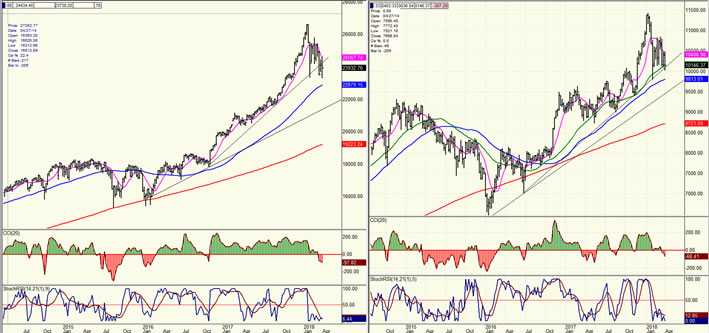
Although the transportation index (right) is generally weaker than the industrials over the long term, the two are still pretty much in sync and I don’t see any indication that a Dow theory signal has been triggered lately, as some have suggested.
UUP (dollar ETF)
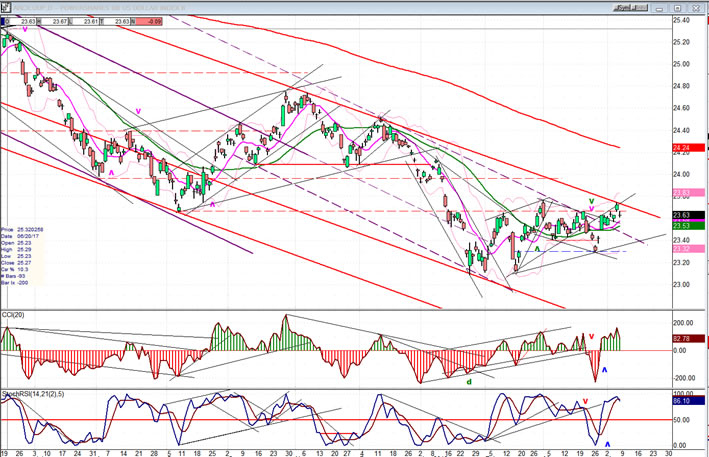
UUP had a quick 3-day drop, suggesting that it was ready to make a new low, but it just as quickly recovered, and is now challenging its intermediate-term trend line. Since it remains above its 30-DMA and its oscillators are not showing any negative divergence, it is possible that it is preparing to break through the trend line; but until the pattern it is making looks more bullish than corrective, we have to assume that it is still consolidating ahead of an eventual resumption of its downward trend.
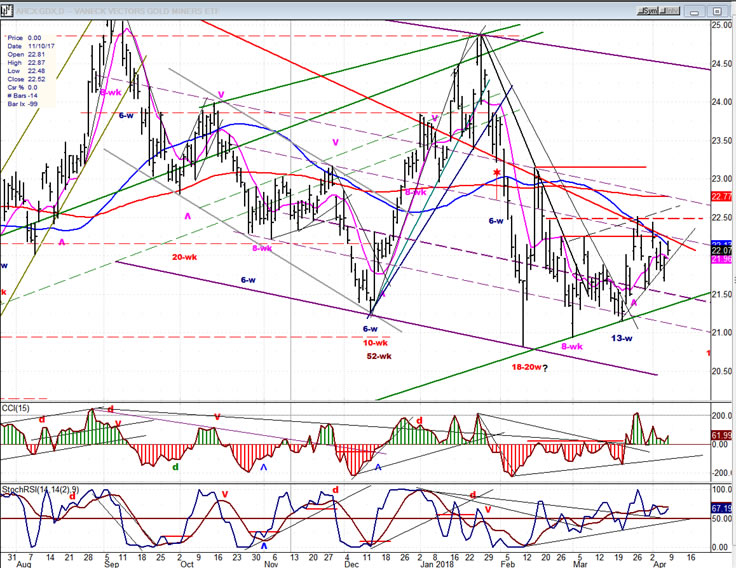
GDX (Gold miners ETF)
GDX continues to trade sideways, unable to break decisively out of the base it has formed since its February low. The Point & Figure chart has made a base pattern suggesting that a move 25.00-25.50 should take place when it does start an uptrend unless an extension of the base takes place..
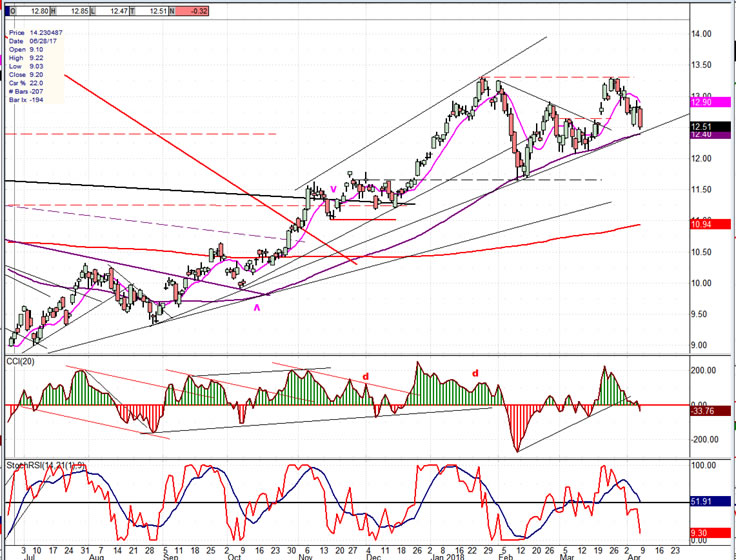
USO (United States Oil Fund)
USO has a valid P&F projection to 14.50, but the chart pattern is deteriorating and is beginning to threaten a move below the 89-DMA, which would result (at least) in more consolidation, and perhaps even an outright reversal of its intermediate trend. Failure to reach a clear P&F target is a sign of weakness; so, unless the index can quickly regain its upside momentum, it risks moving back down toward its (red) 200-DMA.
Summary
There is a cluster of cycle lows due at the end of the week which should cause the index to re-test its 2553 low before this phase of the correction comes to an end. This should be followed by a rally of limited proportion with a final decline into the 40-wk cycle low due in May which would end the current correction.
For a FREE 4-week trial, send an email to anvi1962@cableone.net, or go to www.marketurningpoints.com and click on "subscribe". There, you will also find subscription options, payment plans, weekly newsletters, and general information. By clicking on "Free Newsletter" you can get a preview of the latest newsletter which is normally posted on Sunday afternoon (unless it happens to be a 3-day weekend, in which case it could be posted on Monday).
Disclaimer - The above comments about the financial markets are based purely on what I consider to be sound technical analysis principles uncompromised by fundamental considerations. They represent my own opinion and are not meant to be construed as trading or investment advice, but are offered as an analytical point of view which might be of interest to those who follow stock market cycles and technical analysis.
Andre Gratian Archive |
© 2005-2022 http://www.MarketOracle.co.uk - The Market Oracle is a FREE Daily Financial Markets Analysis & Forecasting online publication.