


Fibonacci Reveals the Stock Market's Next Big Move
InvestorEducation / Elliott Wave Theory Apr 10, 2018 - 03:09 AM GMTBy: EWI

Scientists speculate that Elliott waves are the stock market's "critical structure"
The stock market's recent triple-digit swings might have many investors wondering if the path of prices is completely random.
But, as random as prices may appear, EWI's analysts can assure you that a recognizable Elliott wave pattern is unfolding. In other words, we've been here before, and we have a good idea of how it's going to turn out.
No, the stock market is not random. In fact, Elliott waves are the clearest when volatility is the wildest! You see, volatility is driven by investors' emotions, and Elliott wave price patterns in market charts are nothing more than a reflection of this investor psychology.
What's more: investor psychology unfolds in those recognizable and repetitive patterns that I just mentioned, whether on an intraday basis, day-to-day or across longer time frames.
Even independent scientists say so.
Consider this 1996 quotation from "Stock Market Crashes, Precursors and Replicas" in France's Journal of Physics:
We speculate that the 'Elliott waves' . . . could be a signature of an underlying critical structure of the stock market.
EWI founder Robert Prechter put it this way:
Scientific discoveries have established that pattern formation is a fundamental characteristic of complex systems, which include financial markets. Some such systems undergo "punctuated growth," [or] building fractally into similar patterns of increasing size.
Nature is full of fractals.
Consider branching fractals such as blood vessels or trees: A small tree branch looks like an approximate replica of a big branch, and the big branch looks similar in form to the entire tree.
Now consider that most of nature's fractals are governed by the Fibonacci sequence. It begins with 0 and 1, and each subsequent number is the sum of the previous two:0,1, 1, 2,3,5,8,13,21,34,55 and so on. The Fibonacci sequence also governs the number of waves that form in the movement of aggregate stock prices.
Take a look at this figure from the Wall Street classic book, Elliott Wave Principle:
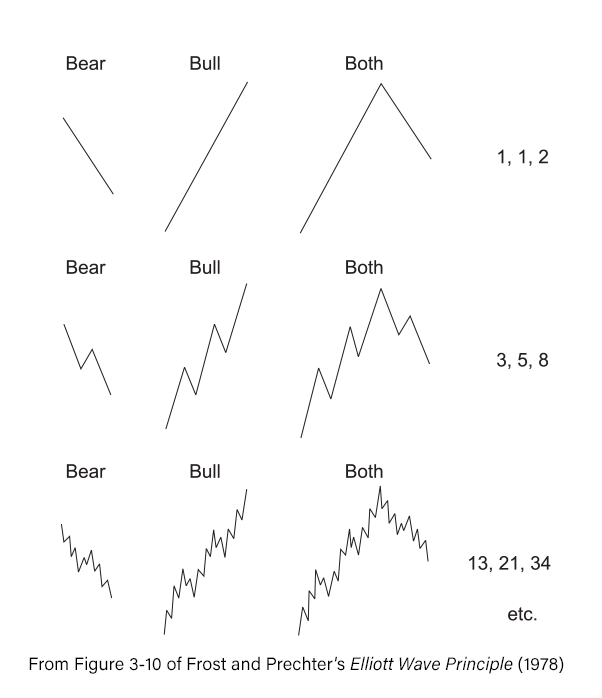
The book notes:
The essential structure of the market generates the complete Fibonacci sequence. The simplest expression of a correction is a straight-line decline. The simplest expression of an impulse is a straight-line advance. A complete cycle is two lines. In the next degree of complexity, the corresponding numbers are 3, 5 and 8. This sequence can be taken to infinity. The fact that waves produce the Fibonacci sequence of numbers reveals that man's collectively expressed emotions are keyed to this mathematical law of nature.
Learn How You Can Use Fibonacci to Improve Your Trading
If you'd like to learn more about Fibonacci and how to apply it to your trading strategy, download the free 14-page eBook, How You Can Use Fibonacci to Improve Your Trading.
EWI Senior Tutorial Instructor Wayne Gorman explains:
- The Golden Spiral, the Golden Ratio, and the Golden Section
- How to use Fibonacci ratios/multiples in forecasting
- How to identify targets and turning points in the markets you trade
- And more!
See how easy it is to use Fibonacci in your trading.
This article was syndicated by Elliott Wave International and was originally published under the headline Fibonacci Reveals the Stock Market's Next Big Move. EWI is the world's largest market forecasting firm. Its staff of full-time analysts led by Chartered Market Technician Robert Prechter provides 24-hour-a-day market analysis to institutional and private investors around the world.
© 2005-2022 http://www.MarketOracle.co.uk - The Market Oracle is a FREE Daily Financial Markets Analysis & Forecasting online publication.