


What’s Bitcoin Really Worth?
Currencies / Bitcoin Apr 20, 2018 - 03:28 PM GMTBy: Mike_McAra

What’s Bitcoin really worth? This question might really drive you mad if you think hard enough about it. $0? $10? Maybe $1,000,000 for one coin? The range of the numbers can make your head spin but it is the explanation behind the number that matters. For the most part, investors don’t have a good reason why Bitcoin is worth this or that, apart from claims that “it will take over the world” and so on. This hasn’t stopped people from trying, though. Is it even important for short-term traders? Can it boost profits on our hypothetical positions?
In an article on the Bloomberg Businessweek website, we have stumbled upon a number analyses of the value of the cryptocurrency. We read:
It took two economists one three-course meal and two bottles of wine to calculate the fair value of one Bitcoin: $200.
It took an extra day for them to realize they were one decimal place out: $20, they decided, was the right price for a virtual currency that was worth $1,200 a year ago, flirted with $20,000 in December, and is still around $8,000. Setting aside the fortunes lost on it this year, Bitcoin, by their calculation, is still overvalued, to the tune of about 40,000 percent. The pair named this the Côtes du Rhône theory, after the wine they were drinking.
If this sounds pretty definite, it actually isn’t. What the two economists used to value Bitcoin is called the quantity theory of money. Without getting too technical, it is a relatively simple equation which lets you recover the value of the currency. The caveat here is that this method is sensitive to the underlying assumptions and inputs. One of the crucial inputs is the value of what the currency buys and things go downhill from here pretty quick.
Does Bitcoin support $1.2 billion in payments? Or maybe it’s transmitting money from illegal activities and we should include this in the figure? Or it’s not that important what kind of resources Bitcoin transmits today but we should focus on what it will transmit in a year (two? three? ten?) and calculate what it’s value is going to be going forward? So, even though we do have an established model, the uncertainty about the critical input is a hindering factor.
Just how hindering is it? We could sugarcoat it, but we won’t. It’s simply too important a matter for Bitcoin investors and the hard facts are that the final value you get varies wildly depending on what input you use. For a static approach, where we focus on the current value of goods Bitcoin buys, a very conservative estimate would be the $20 for one Bitcoin we mentioned before. Different figures for what is bought for Bitcoin give answers like $600. This is still well below the current price. So, if you were to believe in the application of the quantity theory of money to Bitcoin, this would be a bearish implication.
Changing the approach from static to dynamic and assuming Bitcoin might actually become a safe haven the way gold is could give a target of $260,000 to $800,000. OK, by now you probably get the idea. Various principled approaches give results ranging from $20 to $800,000. If you consider different approaches, perhaps even more. What does this mean for you and your decisions?
The first clue is that if we don’t see any evidence of Bitcoin gaining more users and becoming a part of the fabric of the payments system or reacting strongly as a safe haven, then the currency might be trading too high.
The second one is that it is precisely the number of people willing to buy or sell Bitcoin that you have to observe. There are a lot of people who could potentially be interested in Bitcoin but don’t have access to it. It might be the case that the rally to the all-time high in Bitcoin was connected to the launch of first regulated Bitcoin derivatives. At the same time, one of the most striking characteristics of the Bitcoin market is that a vast majority of buyers has no concept of Bitcoin value altogether but ha simply bought the currency in the anticipation of a move up. With Bitcoin not going above the all-time high for some time now, these buyers might be shaken out of the market, fueling further declines. This is precisely the point where short-term considerations become important and so we’ll move on to the technical part of today’s analysis. In other words: for short-term positions, technical factors might be a lot more important that what Bitcoin is theoretically worth.
Superficial Appreciation
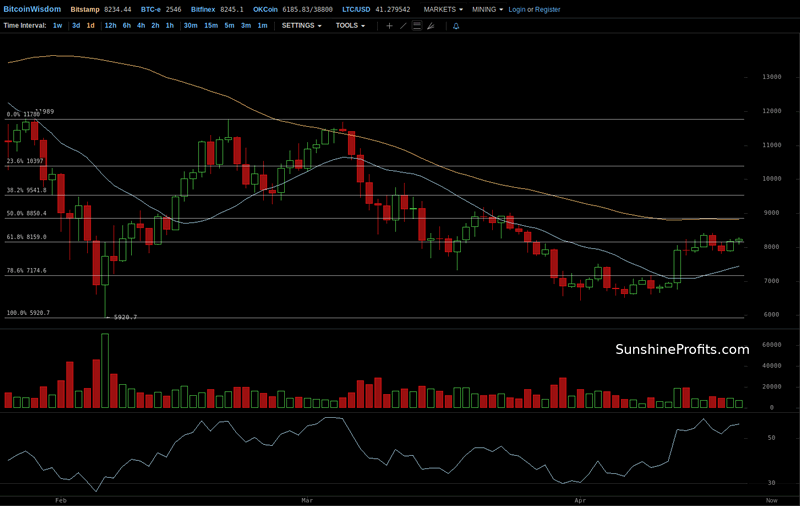
On BitStamp, we see that Bitcoin moved visibly up a couple of days ago. In fact, April 12, when the currency went above $8,000 seems like the most important data point in recent history. But there are a couple of problems with the notion that this one day suddenly made the whole short-term picture bullish.
The first obvious problem is the volume. Yes, it was higher than what we had seen on the the preceding days but it was by no means spectacular. Not even close. This is not what we would typically see during a strong reversal.
The second reason is that we haven’t really seen a confirmed move above the 61.8% Fibonacci retracement. We saw an initial move above this level, the price tested it and went back below it, which was bearish. Now, Bitcoin is back above this level but the move is not strongly bullish as the currency hasn’t confirmed it by closing above it for several days. And so, the move up is still in the close proximity to this retracement and little bearish action can make the implications bearish all over again. In other words, the fact that the move isn’t confirmed greatly weakens any potential bullish indications.
The third reason is that the RSI is now quite close to levels at which Bitcoin tipped over and went down recently. The currency is not yet overbought but if the recent history were to repeat itself, we might see a move down from here, or some additional strength followed by a move down.
Bullish Factor Turned Upside Down
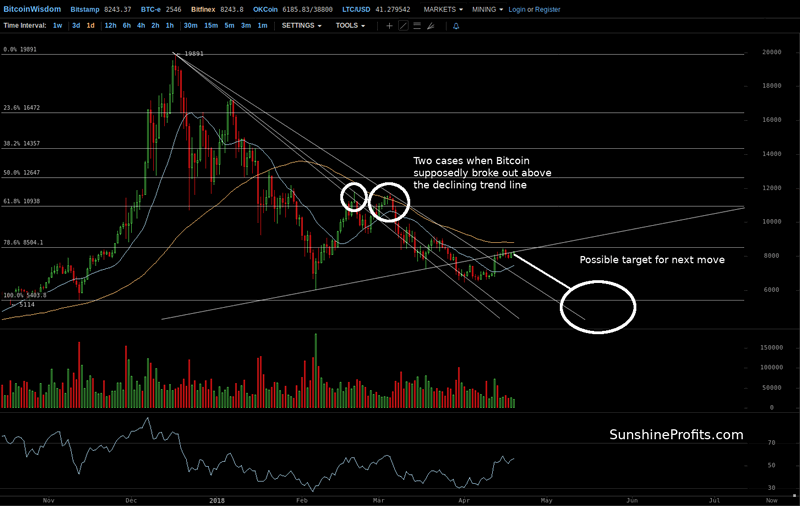
On the long-term Bitfinex chart, we see that there was one bullish development fueled by the recent appreciation. Bitcoin went above the declining resistance line (highest declining line in the chart) and has managed to stay above it for about a week now. This is a development which we would normally consider bullish. Why do we write “normally” here?
Well, let’s take a closer look at what breaking above the declining resistance line based on local tops meant in the previous parts of this decline. It is important that we use the declining resistance line that was available at the moment of the breakout, not the line we are using now as we didn’t know future local tops at that moment. We might argue that we saw the first such move in mid-February when Bitcoin broke out above the lowest declining resistance line visible on the chart (left white circle). Actually, the breakout didn’t even last a full day as the currency went down almost immediately. This was followed by a second breakout above another declining resistance line (middle declining line in the chart). And while the breakout lasted longer, it was followed by serious depreciation back below the trend line.
So, out of two supposedly bullish cases, two were followed by depreciation shortly and one by significant depreciation from which Bitcoin has yet to recover. The current breakout above the third declining resistance line is not as bullish as it might seem. We wouldn’t want to stop at “easy,” so the implications here are either depreciation or a double local top followed by a move down. This means that the implications are bearish rather than bullish at the moment.
Another thing to consider is that Bitcoin tested and went back below the rising resistance line based on local bottoms (only rising line in the chart). This is a bearish indication as it shows that the recent appreciation is not accelerating.
Finally, Bitcoin hasn’t even moved above the 78.6% retracement level. This retracement level is not very important by itself but the fact that Bitcoin hasn’t even moved above it, let alone more significant levels suggests that the implications are unchanged and bearish.
It has been a volatile and potentially profitable ride since January 18 when we opened our hypothetical speculative positions with Bitcoin around $10,500, and we see a good chance that the currency will fall even further boosting the profits even more.
If we do see a move lower, a rebound might follow but it might be short-lived and volatile, making it hard to close shorts and reenter at higher prices. Whether we decide to close speculative short positions at that moment or keep them would depend on local conditions and how the decline plays out.
The potential price targets seem far away now, but Bitcoin has done wilder things in the past!
If you have enjoyed the above analysis and would like to receive free follow-ups, we encourage you to sign up for our daily newsletter – it’s free and if you don’t like it, you can unsubscribe with just 2 clicks. If you sign up today, you’ll also get 7 days of free access to our premium daily Gold & Silver Trading Alerts. Sign up now.
Regards,
Mike McAra
Bitcoin Trading Strategist
Bitcoin Trading Alerts at SunshineProfits.com
Disclaimer
All essays, research and information found above represent analyses and opinions of Mike McAra and Sunshine Profits' associates only. As such, it may prove wrong and be a subject to change without notice. Opinions and analyses were based on data available to authors of respective essays at the time of writing. Although the information provided above is based on careful research and sources that are believed to be accurate, Mike McAra and his associates do not guarantee the accuracy or thoroughness of the data or information reported. The opinions published above are neither an offer nor a recommendation to purchase or sell any securities. Mr. McAra is not a Registered Securities Advisor. By reading Mike McAra’s reports you fully agree that he will not be held responsible or liable for any decisions you make regarding any information provided in these reports. Investing, trading and speculation in any financial markets may involve high risk of loss. Mike McAra, Sunshine Profits' employees and affiliates as well as members of their families may have a short or long position in any securities, including those mentioned in any of the reports or essays, and may make additional purchases and/or sales of those securities without notice.
Mike McAra Archive |
© 2005-2022 http://www.MarketOracle.co.uk - The Market Oracle is a FREE Daily Financial Markets Analysis & Forecasting online publication.