


Our Next Stock Market Dow Fibonacci Price Targets – Get Ready!
Stock-Markets / Stock Markets 2018 May 16, 2018 - 03:30 PM GMTBy: Chris_Vermeulen

 We can’t believe how so many people did not see this upside price swing setting up over the past few weeks. The research we conducted over the past few months was showing us a very clear picture that the US markets would advance in a dramatic format after settling a price bottom after the early February price drop. We would like to remind our readers to reference this link to see how we called this move months (published January 19, 2018) in advance. To quote our earlier work before the markets made all these moves…
“Somewhere near or after February 19th, we expect the NQ price to break to the upside with another 3~5% rally (again, another 350+ pt swing) that should end near March 15th and begin a dramatic downward price move. The ending prediction of the ADL system for April 23, 2018 is $6846.25 – pretty much exactly where we are at right now. “
When you consider the fact that we were making and publicly publishing these predictions about what price would do many weeks in advance and somewhat accurately predicting many of these price swings, one has to ask “just how powerful are these adaptive price modeling systems and what advantage can that provide me?”.
Today, we are going to share some Weekly Adaptive Fibonacci price modeling that clearly illustrates we are in for a very exciting ride in the US markets.
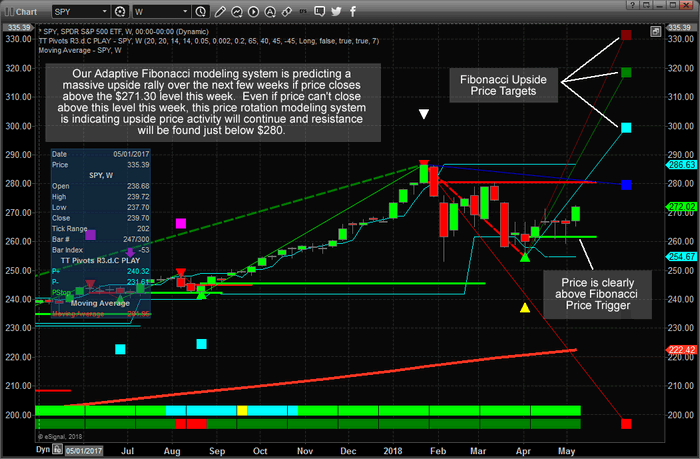
SP500 Index Weekly Chart – (SPY ETF)
This first chart of the SPY is showing us that the current price level is well above the Bullish Fibonacci Trigger level which indicates that current trend is to the upside. It also points to resistance being just below the $280 level. The current price level has already breached a previous price peak and if price advances further by the end of this week, we will consider this a confirmation of a new rotational price high which will further strengthen our opinion that price will push dramatically higher.
Please note the upside Fibonacci price targets because they indicate we could be in for a very dramatic and extended price rally from current levels. The first upside price target level is @ $299.45, the next higher level is @ $318.50 and this furthest target level is @ $331.40. These represent a +10% to +21% upside potential in the SPY. You better believe you won’t want to miss this move and you better be prepared to know how to trade it because we believe volatility is here to stay and nothing goes straight up. We currently have 5 open winning positions with three of them up over 10% already!
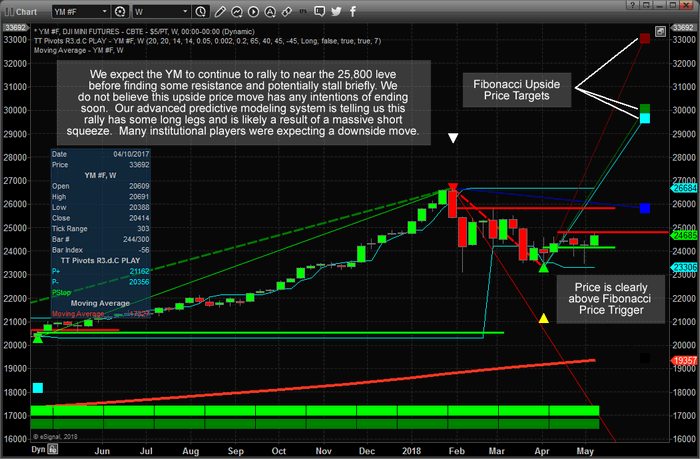
YM (Dow Futures) Weekly chart
Taking that same analysis model and applying it to the YM (Dow Futures) Weekly chart presents an even more dramatic picture of the future price potential. The charts are fairly similar in structure, although where the SPY has already breached the most recent price peak levels, the YM has yet to accomplish this. This would be one thing we are still waiting for in terms of confirmation of the upside potential in the YM.
Yet, taking a look at the other data from this advance price modeling system, we have a very clear indication that a major price top has recently formed near the early February price peak. We can also see an intermediate price bottom has formed near April 2 – resulting in a new upside price rotation. Fibonacci price theory indicates that “price MUST attempt to establish a new price high or low at all times”. Therefore, the failure of the SPY and YM to break below the February 2, 2018 price lows indicates the markets were attempting to hammer our a bottom formation. The rotation of lower high price peaks while the February 2 ultimate low held was a very clear indication that we just needed to wait for the price rotation to establish a new high before we could call a formal end to this downside price swing.
That time is almost upon us as recent price rotation has established a new “higher” rotational price low (on April 30th) and the SPY & NQ have already breached these levels to the upside. Now, we are just waiting for the other US majors (ES & YM) to accomplish this price trigger and we will have confirmation that “price is telling us it wants to rocket higher.
Look at the upside range in the YM – incredible. The first Fibonacci target level is @ 29,683, the second one is @ 30,055 and the highest one is @ 33,058. Let me put that into perspective for you, these represent an upside potential of between +21% to +35% in the YM.
We are certain you are asking yourself “how in the world can this be possible? Everyone has been saying the markets are going to rollover and tank??” We are simply reporting what our modeling systems are telling us is the most likely outcome and we want to urge you to understand these predictive price targets could be months out into the future.
Additionally, new price rotation will create revised price targets as one of the key functions of Fibonacci price theory is that “price will always tell you where it wants to go” as long as you understand how to apply proper Fibonacci price theory.
The final component to all of this research is to ask yourself WHY the US markets would have the potential for +10% to +20% or more upside price moves if everyone thinks the US markets are going to rollover and start trending down? Could it be that so many people have concluded the wrong analysis? Could it be that something dramatic is about to unfold in the global markets that would make the US markets appear to be the “best and safest asset on the planet”? Could it be that we are setting up for a massive leg higher and nearly everyone on the planet has failed to see the upside potential?
Our members have access to much greater insight and analysis than we can share here publically. We reserve our most advanced price modeling systems, predictive analysis and research for our exclusive membership levels. We are warning you that a massive upside swing is about to setup and you’ll want to be prepared for it because this could be a true “once every ten years” type of move. We also urge you to consider joining www.TheTechnicalTraders.com as a member to receive all of our detailed updates, daily videos, trading signals and more. If you don’t believe we can assist you in your future with our research, analysis and other features and benefits, you can cancel your subscription and move onto something else. Either way, we urge you to be prepared for this next move higher and take a few minutes to read over our most recent public research posts.
Visit www.TheTechnicalTraders.com to see how we can help you achieve greater success.
Chris Vermeulen
www.TheTechnicalTraders.com
Chris Vermeulen has been involved in the markets since 1997 and is the founder of Technical Traders Ltd. He is an internationally recognized technical analyst, trader, and is the author of the book: 7 Steps to Win With Logic
Through years of research, trading and helping individual traders around the world. He learned that many traders have great trading ideas, but they lack one thing, they struggle to execute trades in a systematic way for consistent results. Chris helps educate traders with a three-hour video course that can change your trading results for the better.
His mission is to help his clients boost their trading performance while reducing market exposure and portfolio volatility.
He is a regular speaker on HoweStreet.com, and the FinancialSurvivorNetwork radio shows. Chris was also featured on the cover of AmalgaTrader Magazine, and contributes articles to several leading financial hubs like MarketOracle.co.uk
Disclaimer: Nothing in this report should be construed as a solicitation to buy or sell any securities mentioned. Technical Traders Ltd., its owners and the author of this report are not registered broker-dealers or financial advisors. Before investing in any securities, you should consult with your financial advisor and a registered broker-dealer. Never make an investment based solely on what you read in an online or printed report, including this report, especially if the investment involves a small, thinly-traded company that isn’t well known. Technical Traders Ltd. and the author of this report has been paid by Cardiff Energy Corp. In addition, the author owns shares of Cardiff Energy Corp. and would also benefit from volume and price appreciation of its stock. The information provided here within should not be construed as a financial analysis but rather as an advertisement. The author’s views and opinions regarding the companies featured in reports are his own views and are based on information that he has researched independently and has received, which the author assumes to be reliable. Technical Traders Ltd. and the author of this report do not guarantee the accuracy, completeness, or usefulness of any content of this report, nor its fitness for any particular purpose. Lastly, the author does not guarantee that any of the companies mentioned in the reports will perform as expected, and any comparisons made to other companies may not be valid or come into effect.
Chris Vermeulen Archive |
© 2005-2022 http://www.MarketOracle.co.uk - The Market Oracle is a FREE Daily Financial Markets Analysis & Forecasting online publication.