


HFC HollyFrontier Corporation Impulsive Elliott Wave Rally
Companies / Company Chart Analysis May 18, 2018 - 04:29 AM GMT

Holly Corporation and Frontier Oil merged in July 2011 to form HollyFrontier Corporation (NYSE: HFC). The company is a petroleum refiner and distributor of petroleum products, from gasoline to petroleum-based lubricants and waxes.
Over the past 2 years, Hollyfrontier Corp performed better than majority of its peers in the Oil & Gas Refining and Basic Materials sector. Its stock price is already up 34.4% year-to-date and still expected to see more gains as Oil price is also up 20% this year which helped the petroleum companies to perform well recently.
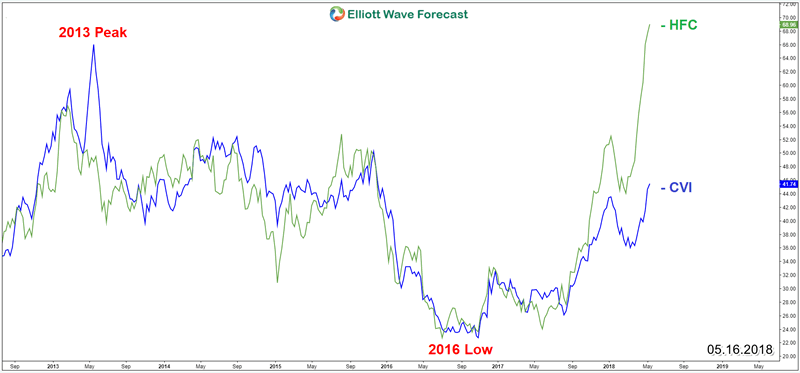
In the below chart, we can notice that HFC and CVR Energy (NYSE: CVI) are closely correlated together. They shared the same cycle from 2013 peak then the current one from 2016 low. However, in the recent 2 months, HollyFrontier managed to outperform with a strong move to the upside breaking to new all time highs despite CVI being one of the leading stocks in Energy sector in recent 2 years and showing an impulsive structure but failed to do the same.
Overlay of HFC and CVI
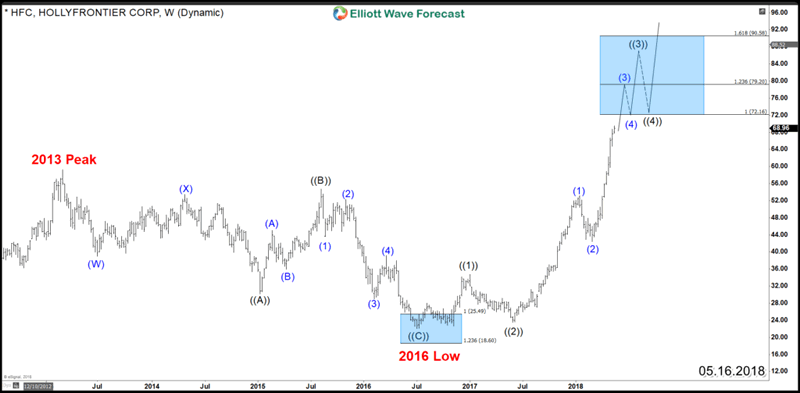
After spending 3 years in a corrective cycle to the downside (2013-2016), which took the form of a 3 waves Flat structure, HFC started a new bullish cycle advancing in 5 waves impulsive structure building a nest and looking to reach extreme area around $79.2 – $90.5. Down from there, the stock can see 3 waves pullback before resuming higher again as it’s expected to remain supported and find buyers in 3 , 7 or 11 swing.
HFC Elliott Wave Weekly Chart
If you’re interested in getting more insights about the Energy stocks then take this opportunity and try our services 14 days for Free to learn how to trade Stocks and ETFs using our blue boxes and the 3, 7 or 11 swings sequence. You will get access to our 78 instruments updated in 4 different time frames, Live Trading & Analysis Session done by our Expert Analysts every day, 24-hour chat room support and much more.
By Ayoub Ben Rejeb
https://elliottwave-forecast.com
ElliottWave-Forecast has built its reputation on accurate technical analysis and a winning attitude. By successfully incorporating the Elliott Wave Theory with Market Correlation, Cycles, Proprietary Pivot System, we provide precise forecasts with up-to-date analysis for 78 instruments including Forex, Commodities, Indices and a number of Stocks & ETFs from around the World. Our clients also have immediate access to our proprietary Actionable Trade Setups, Market Overview, 1 Hour, 4 Hour, Daily & Weekly Wave Counts. Live Screen Sharing Sessions, Daily Technical Videos, Elliott Wave Setup and Weekend videos .
Copyright © 2018 ElliottWave-Forecast - All Rights Reserved Disclaimer: The above is a matter of opinion provided for general information purposes only and is not intended as investment advice. Information and analysis above are derived from sources and utilising methods believed to be reliable, but we cannot accept responsibility for any losses you may incur as a result of this analysis. Individuals should consult with their personal financial advisors.
© 2005-2022 http://www.MarketOracle.co.uk - The Market Oracle is a FREE Daily Financial Markets Analysis & Forecasting online publication.