


What is More Reliable than the Andrews Pitchfork?
InvestorEducation / Technical Analysis Jun 01, 2018 - 12:25 PM GMTBy: Ron_Jaenisch

 When my friend Professor Alan Hall Andrews was most active as a trader and writer it was prior to 1980. After examining his writings and use (in the 1970’s) of the various lines related to the median lines verses the action reaction lines, it is easy to come to the conclusion that he favored the Action Reaction lines over what is commonly referred to as the Andrews Pitchfork. To answer this question for myself I examined various concepts that Andrews taught in his writings, shortly prior to his passing on found that most of them were median line related. This was when he came up with the modified Schiff line which is actually a derivative of a trend line. Trend lines are lines he advocated using along with the Action Reaction Lines in the 1960’s and 1970’s.
Pitchforks are easy to draw and there are plenty of examples in prior articles, in this magazine. For new traders the question comes up……… what are Action Reaction lines? For readers that already know all about them the last paragraph might be a good place to continue reading.
Roger Babson based his theory upon Newtonian Physics. For readers unfamiliar with these theories, suffice it to say that when something is moving in a specific direction, it will keep on moving in that direction until other force(s) cause it to stop or go in the opposite direction. Then we arrive at the third law of motion, which is a bit more complicated.
The third law states that all forces exist in pairs: if one object A exerts a force FA on a second object B, then B simultaneously exerts a force FB on A, and the two forces are equal and opposite: FA = −FB. The third law means that all forces are interactions between different bodies and, thus, that there is no such thing as a unidirectional force or a force that acts on only one body. This law is sometimes referred to as the action/reaction law, with FA termed the "action" and FB the "reaction." The action and the reaction are simultaneous, and it does not matter which is called the action and which is called reaction; both forces are part of a single interaction, and neither force exists without the other
The two forces in Newton's third law are of the same type (e.g., if the road exerts a forward frictional force on an accelerating car's tires, then it is also a frictional force that Newton's third law predicts for the tires pushing backward on the road).
From a conceptual standpoint, Newton's third law is seen when a person walks: they push against the floor, and the floor pushes against the person. Similarly, the tires of a car push against the road while the road pushes back on the tires—the tires and road simultaneously push against each other. In swimming, a person interacts with the water, pushing the water backward, while the water simultaneously pushes the person forward—both the person and the water push against each other. The reaction forces account for the motion in these examples. These forces depend on friction; a person or car on ice, for example, may be unable to exert the action force to produce the needed reaction force.
Roger Babson is well known for applying the laws of physics over one hundred years ago to forecast future price movement in securities and indices. This brings some to wonder if Roger Babson’s techniques could be used to prove the arrow of time concept. Physicists, like Elliott wave theorists, differ in their opinion about the same thing. In the interest of simplicity, this work will answer two questions that may be asked regarding the arrow of time.
Can the future be accurately predicted by the past?
Can the past be accurately predicted by the future?
According to Wikipedia:
Psychological time is, in part, the cataloguing of ever increasing items of memory from continuous changes in perception. In other words, things we remember make up the past, while the future consists of those events that cannot be remembered. The ancient method of comparing unique events to generalized repeating events such as the apparent movement of the sun, moon, and stars provided a convenient grid work to accomplish this. The consistent increase in memory volume creates a mental arrow of time. Storing a memory, from an information theoretic perspective, requires an increase in entropy, thus the perceptual arrow ultimately follows from the thermodynamic arrow.
A related mental arrow arises because one has the sense that one's perception is a continuous movement from the known (Past) to the unknown (Future). Anticipating the unknown forms the psychological future which always seems to be something one is moving towards, but, like a projection in a mirror, it makes what is actually already a part of memory, such as desires, dreams, and hopes, seem ahead of the observer. The association of "behind = past" and "ahead = future" is itself culturally determined. For example, the Chinese and the Aymara people both associate "ahead = past" and "behind = future".[8] In Chinese, for instance, the term "the day after tomorrow" literally means "behind day" while "the day before yesterday" is referred to as "front day" and in Hindi (an Indian language), the term used for "tomorrow" and "yesterday" is the same.
As one considers the Arrow of Time theory, there are two straightforward questions. Can the future be accurately predicted by the past and can the past be accurately predicted by the Future? As you will see in the following, the reaction in the future is equal and opposite and, as a result, a future event can predict a past event.
The second question is, does an action create a reaction in the future? If actions and reactions are equal and opposite, is it possible that actions and reactions, which are separated by time, are actually created at the same moment?
In private discussions, Roger noted that during a long term upward move of a company stock, the company often makes foolish investments. These are ignored at the time because of the overwhelming increase in revenue and profits from other aspects of the company. There comes a time when the company writes off these foolish investments or divests itself of them. These are commonly known as write-offs. Write-offs typically occur when the stock of a company is in a down trend.
Babson’s Action-Reaction – How it works
Recent computer-based studies of this theory have led some to the conclusion that the area above the normal line is very useful in forecasting the turning points in the area below the normal line. Furthermore, as will be shown, the extremes of the areas above the normal line can also be forecast successfully.
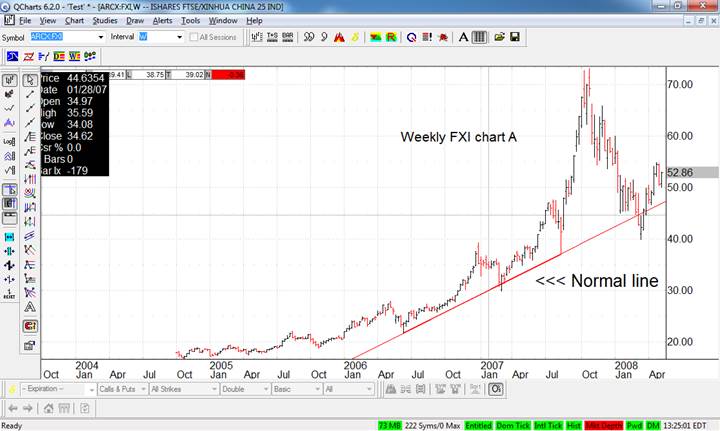
An example of the application to the FXI chart above took three steps. First, using a special protocol, the normal line was selected and drawn.
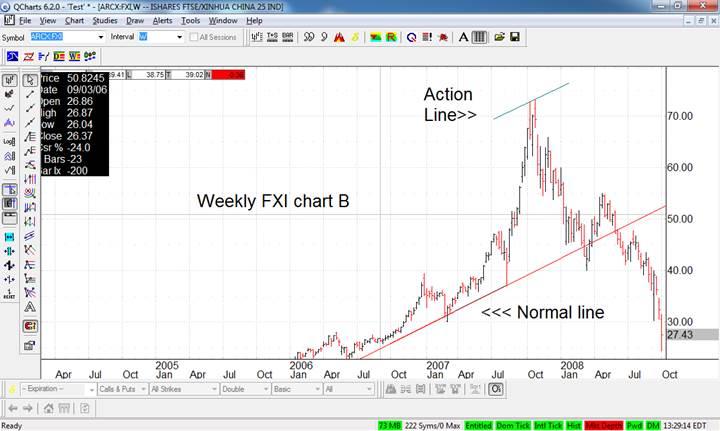
Thereafter, the high pivot point was selected for drawing an action line parallel to the normal line, as seen in Chart B.
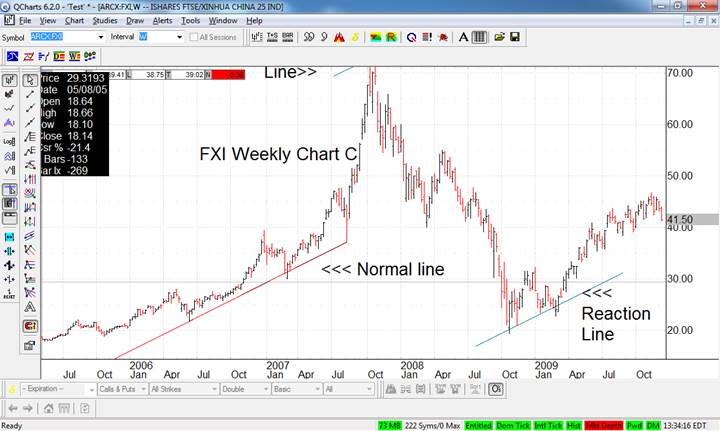
Finally, the pivot area of the recession area below the normal line was forecasted by drawing a reaction line. The reaction line is always drawn parallel to the action and normal line. The reaction lines are located by drawing a line parallel to the normal line and the same distance from the normal line as the action line.
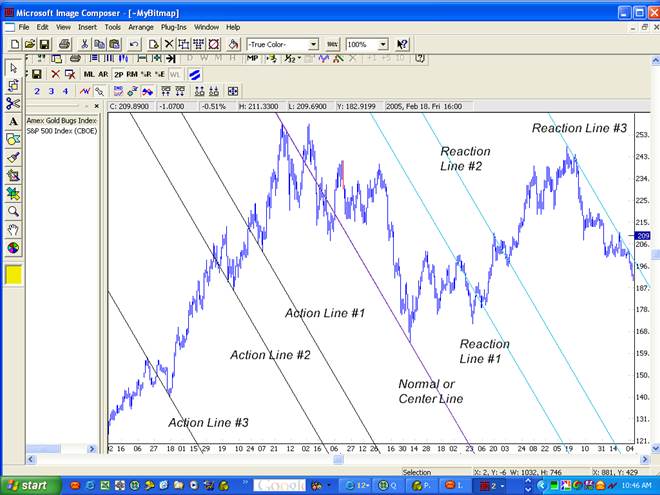
In the above gold chart, the normal line was selected using the normal line selection procedure. Thereafter, three action points were selected. Note that the action and reaction points are equidistant from each other in relation to the normal line. Note also that when the normal line is down sloping, the action points selected are low points and the reaction points are high points. The selection of the low action points from extremes is not universal in the action-reaction line calculations processes. Also not universal is in this case, the action points are equal and opposite to the reaction from the normal line.
Babson’s Action-Reaction verses the Andrews Pitchfork
According to the 62 page publicly available Andrews Action Reaction course, there are at least five ways to determine the normal line and the corresponding reaction lines. Placing all or even some of them on a chart can result in brain freeze. At his last public seminar, Professor Andrews was recorded on video. In it, he explains the process for finding reliable normal aka center lines and the process for finding reliable reaction lines. He suggests a specific method for using them and described various normal/center lines at the event. These methods were used for many years. Recently we looked into answers to the question: What are the steps for determining the normal line when it comes to having the best risk reward and win ratio? In his writings in the 1970’s, Andrews described two other center lines which are not publicly known. One was the ORE. The second of these (which was discovered in 2018 in his writings) is incredibly reliable and more often than not, results in the move going all the way to at least reaction line #3 and when another indicator is true at time of trade entry, reaction line #7 is typically surpassed. Interestingly, just prior to the Action Reaction trade entry points, the pitchfork signals were already in the trade, when using the Action Reaction method, but when it was used alone the median line method had a significantly higher failure rate than the Action Reaction method.
By Ron Jaenisch
Copyright 2018 © Ron Jaenisch - All Rights Reserved
Disclaimer: The above is a matter of opinion provided for general information purposes only and is not intended as investment advice. Information and analysis above are derived from sources and utilising methods believed to be reliable, but we cannot accept responsibility for any losses you may incur as a result of this analysis. Individuals should consult with their personal financial advisors.
© 2005-2022 http://www.MarketOracle.co.uk - The Market Oracle is a FREE Daily Financial Markets Analysis & Forecasting online publication.