


Is Gold Price On Verge Of A Bottom, See For Yourself
Commodities / Gold and Silver 2018 Aug 22, 2018 - 04:21 PM GMTBy: Chris_Vermeulen

 The recent downward price swing in Gold has kept Goldbugs frothing at what they believe is a very unusual and unexplained price function in the face of so much uncertainty throughout the globe. With Turkey, Russia, China and many others experiencing massive economic and currency crisis events, Gold has actually been creeping lower as the US Dollar strengthens. It is almost like a “Twilight Zone” episode for Gold Bulls.
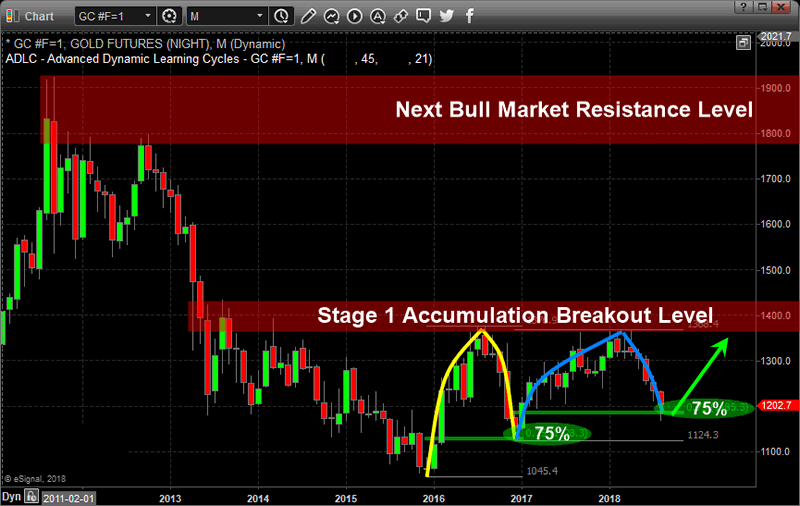
The setup for a gold rally has been in place for over a decade. Much like in 2006 through 2008, the current price and volatility of Gold is simply mundane. For the past two years, Gold has rotated between $1190 and $1360 – within a $180 range. Certainly, Gold traders were able to find some profits within this range, but no breakout trends have been established since early 2016 when the price of Gold changed from Bearish to Bullish and a 31% rally took place driving prices $328.80 higher from the lows.
Our team of researchers, at www.TheTechnicalTraders.com, believe something very interesting may be taking place in Gold right now – almost like a “Deja Vu” of the past. A double setup appears to have taken place recently and we believe the bottom may have already formed in Gold for now.
In early 2016 through November 2016 where price rallied 31% then retraced nearly 75% to form the second leg higher. This deep retracement of price was indicative of a wide price rotation before another leg higher pushed back up to near the all-time highs.
From 2017 until now the Gold chart shows another 75% price retracement from recent highs once again. This second 75% retracement could be a massive bottom formation setting up in Gold and could be a huge “wash-out” low price. We believe this unique retracement is indicative of a massive price breakout over the next year or so as the price of gold is forming what Stan Weinstein calls a Stage 1 Accumulation.
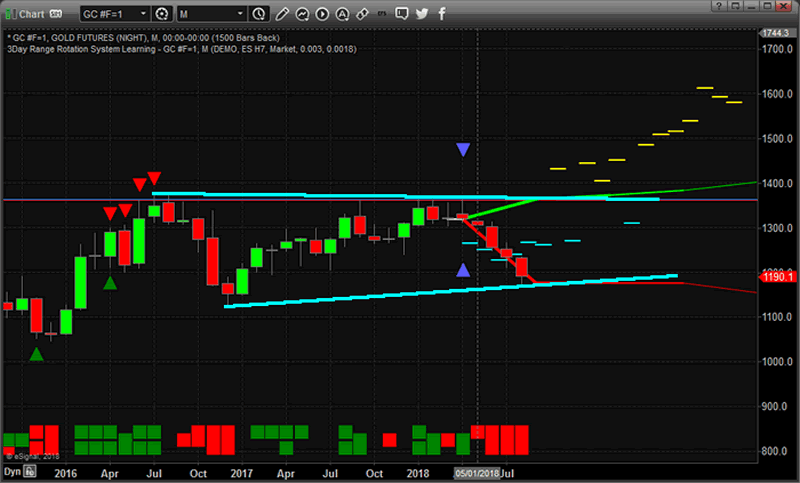
Now, let’s zoom in and take a look at the weekly chart and our Adaptive Dynamic Learning model, the predictive analysis suggests that Gold prices should begin to bottom within the next week or two and begin to climb much higher over the next 3~10+ weeks.
This pattern consists of 12 unique instances of data and suggests that the future upswing will start rather mild for the first 2 weeks, then begin to accelerate as time progresses. It appears we have a strong potential to see prices above $1400 within the next 5~8 weeks or so and you look at the previous chart above, what is the $1400 level? You got it! Resistance, and if price breaks out above $1400 a new bull market would be triggered!
As many of you are aware, Gold is often a move to safety when the global economy begins to show signs of chaos or weakness. We believe the move in the US Dollar will stall and possibly correct as this move takes place. If Gold were to rally while the US Dollar continued to strengthen, you can clearly assume that a flight to safety is taking place and it includes a massive capital migration toward US equities and GOLD. If the rally in gold is seen while the US Dollar weakens or stalls, then we are seeing a move to safety while the currency markets address regional and global currency market issues.
Either way, we expect Gold to begin a new rally higher off of this 75% retracement level to complete the Pennant formation that is currently set up for a Wave 5 upside price expansion. Some of this technical analysis may be over your head as it can be confusing, but you should get the gist of things which is that precious metals should find a bottom and there is the potential that a massive bull market could be on the horizon if price rallies quickly. Be prepared for this move because the Gold shorts will likely be forced to cover their positions within the next few weeks as this move begins to accelerate higher.
Visit www.TheTechnicalTraders.com to learn how we can help you find these types of swings in the major markets. We alert our clients well in advance of these swings and deliver daily video content to all of our members before the market opens each day. Our objective is to make you a better trader and to help you find successful setups to create greater success. Visit our website to learn how we can help you become a better trader today.
Chris Vermeulen
www.TheTechnicalTraders.com
Chris Vermeulen has been involved in the markets since 1997 and is the founder of Technical Traders Ltd. He is an internationally recognized technical analyst, trader, and is the author of the book: 7 Steps to Win With Logic
Through years of research, trading and helping individual traders around the world. He learned that many traders have great trading ideas, but they lack one thing, they struggle to execute trades in a systematic way for consistent results. Chris helps educate traders with a three-hour video course that can change your trading results for the better.
His mission is to help his clients boost their trading performance while reducing market exposure and portfolio volatility.
He is a regular speaker on HoweStreet.com, and the FinancialSurvivorNetwork radio shows. Chris was also featured on the cover of AmalgaTrader Magazine, and contributes articles to several leading financial hubs like MarketOracle.co.uk
Disclaimer: Nothing in this report should be construed as a solicitation to buy or sell any securities mentioned. Technical Traders Ltd., its owners and the author of this report are not registered broker-dealers or financial advisors. Before investing in any securities, you should consult with your financial advisor and a registered broker-dealer. Never make an investment based solely on what you read in an online or printed report, including this report, especially if the investment involves a small, thinly-traded company that isn’t well known. Technical Traders Ltd. and the author of this report has been paid by Cardiff Energy Corp. In addition, the author owns shares of Cardiff Energy Corp. and would also benefit from volume and price appreciation of its stock. The information provided here within should not be construed as a financial analysis but rather as an advertisement. The author’s views and opinions regarding the companies featured in reports are his own views and are based on information that he has researched independently and has received, which the author assumes to be reliable. Technical Traders Ltd. and the author of this report do not guarantee the accuracy, completeness, or usefulness of any content of this report, nor its fitness for any particular purpose. Lastly, the author does not guarantee that any of the companies mentioned in the reports will perform as expected, and any comparisons made to other companies may not be valid or come into effect.
Chris Vermeulen Archive |
© 2005-2022 http://www.MarketOracle.co.uk - The Market Oracle is a FREE Daily Financial Markets Analysis & Forecasting online publication.