


Stock Market Setting Up For A Bigger Pullback
Stock-Markets / Stock Markets 2018 Aug 27, 2018 - 09:37 AM GMTBy: Chris_Vermeulen

 Our researchers at Technical Traders Ltd. have identified a potential in the markets that many people may have overlooked or are not prepared for. The recent strength in the markets has skewed many opinions toward the bullish perspective as the S&P, DOW, Transports and Nasdaq have all pushed towards new all-time highs.
We are writing this research post to alert our followers that we believe the US Indices and major markets may be setting up for a moderately deep price pullback that could be in excess of 5% or more.
Our proprietary price modeling systems and advanced learning models are warning us that the upside trend is likely still in place, yet there is a growing and stronger potential for a price pullback that could result in a 4~7% pullback in the near future. We want to alert all our followers that we believe an immediate price pullback is setting up and to protect your long positions.
The continued rally in the US majors has allowed many traders to become overly comfortable to the potential for a major pullback. Much like what happened in February 2018, when a bigger pullback did happen, all of the sudden traders were screaming that a massive top had formed and that everyone should watch out for a further breakdown in price values. We are not saying that right now and we want to be clear – so please read the following statement very clearly…
We believe a 4~7% price pullback is setting up in the US markets that will likely extend into September 2018 before forming a new price bottom and prompting the markets to rally to new all-time highs before the end of 2018. We believe this price pullback/rotation is healthy for the markets after such an extended rally and we believe many traders are discounting the potential for such a move and will surprise many traders. Protect your long positions and prepare for this type of price pullback. You will be able to re-enter your positions as the bottom sets up and a new rally begins.
Let’s take a look at some of the charts that support our research.
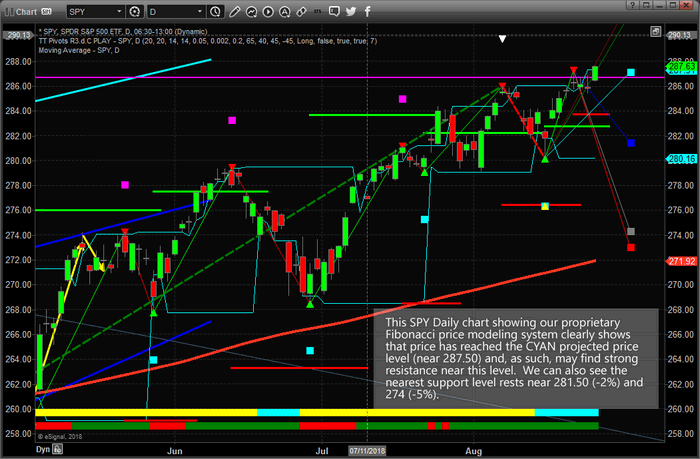
We’ll start with the SPY and highlight our proprietary Fibonacci price modeling system. The recent Daily price rotation in the SPY has illustrated that price has reached the CYAN projected price point. This should be the first level of resistance that price encounters within the current rally. The lower BLUE projected price point is the current major support level. The fact that we are currently breaching the all-time high levels adds greater weight to the fact that resistance should be relatively strong near these highs and that we could see a major price rotation setting up near these levels. The downside Fibonacci price targets suggest a 2~5% price decline is possible given current price ranges.
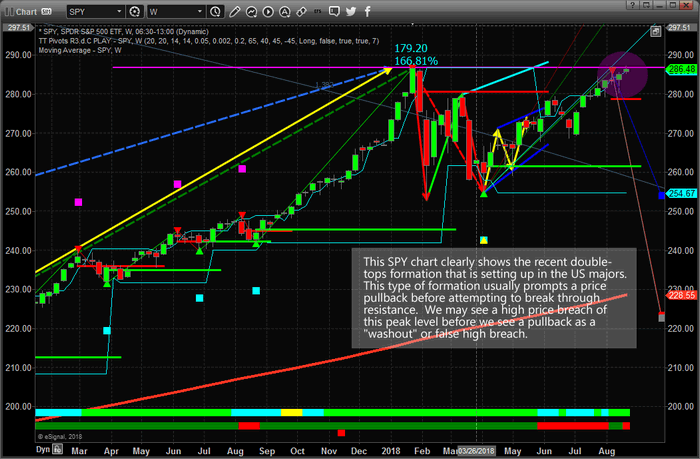
This Weekly SPY chart highlights the key resistance level that is currently at play in the markets from the February 2018 highs. Our proprietary Fibonacci price modeling system is suggesting that prices could, and should, continue to rally to well above the current highs over time. Yet, the current Weekly downside price projection levels show a potential for price to move to 254.65 as the nearest key Fibonacci support level – and possibly even lower to near $224. Yes, this Weekly chart is indicating the SPY could fall -12% on a medium-term pullback or as far as -22% with a deeper pullback and still have the potential for new highs before the end of 2018.
You might be asking, “how could this happen and what would prompt this move?”. We assume it would be some geopolitical or global economic mini-crisis that would prompt such a move, but it could be that investors simply rotate capital out of the US markets chasing opportunities in other foreign markets or debt instruments. The fundamentals for a continued US rally are still in place for at least 6+ months – we are just concerned that a moderately deeper pullback than many are expecting is right around the corner and about to hit the markets. We don’t believe this pullback will be the start of a new bearish price trend.
If you want to learn more about our research, services and how we can help you find and execute better trades, then please visit www.TheTechnicalTraders.com to learn about our team of researchers and products for traders. You can also review all of our past research posts to learn how we have been calling these market moves for the past 12+ months. We urge you to pay attention to our work because we believe we have some of the most advanced and accurate market timing tools on the planet. Time will tell if we are correct with Today’s call – bet we want you to understand the risks and potential rewards that are presented right now in the markets. Take a minute to see how we can help you become a better trader as these moves play out over the next 12+ months.
Chris Vermeulen
www.TheTechnicalTraders.com
Chris Vermeulen has been involved in the markets since 1997 and is the founder of Technical Traders Ltd. He is an internationally recognized technical analyst, trader, and is the author of the book: 7 Steps to Win With Logic
Through years of research, trading and helping individual traders around the world. He learned that many traders have great trading ideas, but they lack one thing, they struggle to execute trades in a systematic way for consistent results. Chris helps educate traders with a three-hour video course that can change your trading results for the better.
His mission is to help his clients boost their trading performance while reducing market exposure and portfolio volatility.
He is a regular speaker on HoweStreet.com, and the FinancialSurvivorNetwork radio shows. Chris was also featured on the cover of AmalgaTrader Magazine, and contributes articles to several leading financial hubs like MarketOracle.co.uk
Disclaimer: Nothing in this report should be construed as a solicitation to buy or sell any securities mentioned. Technical Traders Ltd., its owners and the author of this report are not registered broker-dealers or financial advisors. Before investing in any securities, you should consult with your financial advisor and a registered broker-dealer. Never make an investment based solely on what you read in an online or printed report, including this report, especially if the investment involves a small, thinly-traded company that isn’t well known. Technical Traders Ltd. and the author of this report has been paid by Cardiff Energy Corp. In addition, the author owns shares of Cardiff Energy Corp. and would also benefit from volume and price appreciation of its stock. The information provided here within should not be construed as a financial analysis but rather as an advertisement. The author’s views and opinions regarding the companies featured in reports are his own views and are based on information that he has researched independently and has received, which the author assumes to be reliable. Technical Traders Ltd. and the author of this report do not guarantee the accuracy, completeness, or usefulness of any content of this report, nor its fitness for any particular purpose. Lastly, the author does not guarantee that any of the companies mentioned in the reports will perform as expected, and any comparisons made to other companies may not be valid or come into effect.
Chris Vermeulen Archive |
© 2005-2022 http://www.MarketOracle.co.uk - The Market Oracle is a FREE Daily Financial Markets Analysis & Forecasting online publication.