


ALERT: Gold-to-Silver Ratio Spikes to Highest Level in 27 Years!
Commodities / Gold and Silver 2018 Sep 11, 2018 - 01:32 PM GMTBy: Jason_Hamlin

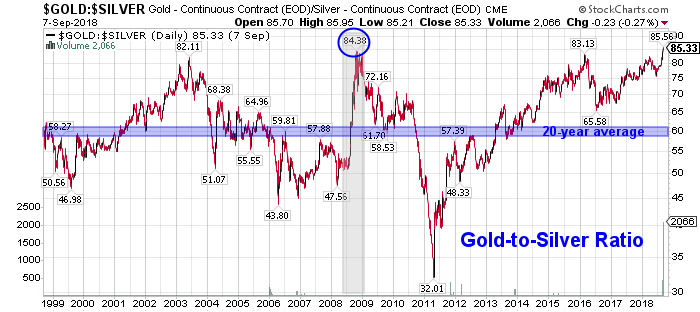
 The gold-silver ratio has been one of the most reliable technical ‘buy’ indictors for silver, whenever the ratio climbs above 80. The gold-to-silver ratio has now spiked above 85, which is the highest level of this entire 18-year bull market! In fact, you have to go back 27 years to 1991 for the ratio to be higher than it is today. Amazingly, the ratio is currently higher than it was at the depths of the 2008-09 financial crisis (circled in the chart below).
The gold-to-silver ratio is a powerful trading signal that can help to identify buying or selling opportunities in the precious metals sector. The ratio represents the number of silver ounces it takes to buy a single ounce of gold. It might sound simple, but this ratio is more powerful than it may seem at first blush.
Historic Ratios for Comparison
The ratio of silver to gold in the earth’s crust is 17.5:1. In Roman times, the price ratio was set at 12 to 1. In 1792, the gold/silver price ratio was fixed by law in the United States at 15:1, which meant that one troy ounce of gold was worth 15 troy ounces of silver; a ratio of 15.5:1 was enacted in France in 1803. The average gold/silver price ratio during the 20th century, however, was 47:1.
Over the past 20 years, the ratio has averaged right around 60:1. Thus, the current ratio of 85 is very high historically and nearly 60% above the 20-year average. The ratio is signaling that silver is extremely undervalued relative to gold at this point in time.
The all-time high for the gold-to-silver ratio occurred in February of 1991, at the height of an economic Recession. The Recession of the early 1990s lasted from July 1990 to March 1991 and was driven by a restrictive monetary policy and Iraq’s invasion of Kuwait in the summer of 1990. The latter drove up the world price of oil, decreased consumer confidence, and exacerbated the downturn that was already underway.
Take a look at the historical chart for the gold-to-silver ratio for perspective on just how high it is today at 85…
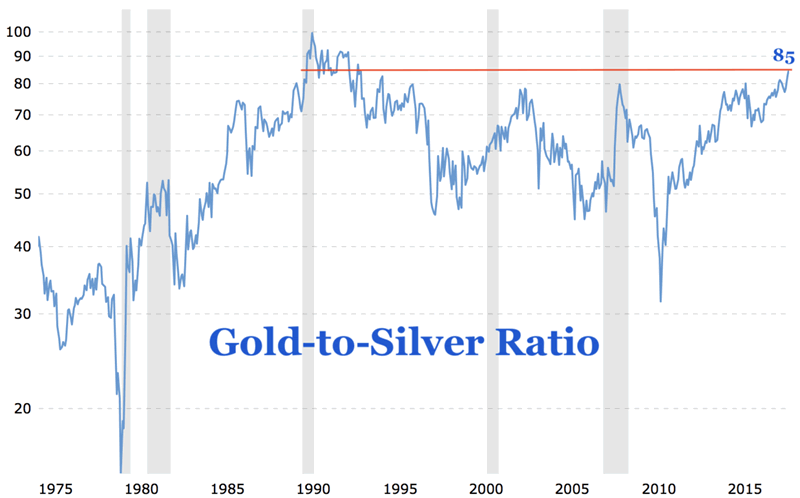
In the past, the gold-to-silver ratio spiked higher during times of economic instability or Recession (see grey shaded areas). This makes sense as gold is generally viewed more strongly as a safe-haven asset than silver and institutional investors move funds primarily to gold (or dollars) for safety. Furthermore, nearly 50% of silver’s demand is industrial, so economic contraction would impact the price more severely.
The silver price falling more rapidly than the gold price or climbing more slowly than the gold price increases the ratio. Put simply, it takes an increasing number of silver ounces to buy a single ounce of gold during these periods.
Yet, the current gold-to-silver spike is happening absent a major crisis, as economic growth picks up and major stock indices hit new all-time highs. It looks a little reminiscent of the period from 1982 to 1987, leading up to the Black Monday stock market crash. The ratio also rose from 1988 to 1990, again leading into a major stock market correction.
Is the Current Spike in the Gold/Silver Ratio Forecasting Another Stock Market Crash?
The ratio typically spikes to extreme levels during the depths of an economic crisis or leading up to a significant correction in the equity markets. The stock market is currently very robust and enjoying an unprecedented 9-year bull market with gains in excess of 300% for the S&P 500 or 400% for the NASDAQ. So the spike is not driven by a crisis that already exists, increasing the odds that we are quickly approaching a major correction in the markets.
Why else would investors be favoring gold so strongly over silver during a time of healthy economic growth?
The fundamental supply and demand numbers do not support gold’s outperformance versus silver. Gold demand fell by 7% in 2017, while silver demand fell just 2%. Supply for both gold and silver fell 4% in 2017, according to estimates by the World Gold Council and Silver Institute.
Silver Eagles Sell Out at U.S. Mint After Strong Demand in August
It is hard to know for sure if the gold/silver ratio has peaked, but some people appear to be taking advantage of the low silver prices lately. The U.S. Mint Sold 1,530,000 American Silver Eagles in August, the most in a single month since 2015! In fact, demand has been so strong that the U.S. Mint recently reported that they have sold out of 2018 American Silver Eagles.
“This is to inform you that due to recent increased demand, the United States Mint has temporarily sold out of its inventories of 2018 American Eagle Silver Bullion Coins.
All orders received prior to this communication shall be honored.
The United States Mint is in the process of producing additional 2018 American Eagle Silver Bullion Coins. We will make these coins available for sale shortly.”
How to Profit from the Gold-to-Silver Ratio Extreme
The bottom line is that silver is currently very undervalued relative to gold. This sets up an opportunity to buy silver and sell gold, potentially via a pair trade using the highly liquid gold and silver ETFs. Those looking to add to physical bullion investments might consider shifting their purchases to silver at this point. We also see opportunities for mining stock investors to profit from this extreme in the gold-to-silver ratio, which we covered in the latest edition of The Contrarian Report.
By Jason Hamlin
Jason Hamlin is the founder of Gold Stock Bull and publishes a monthly contrarian newsletter that contains in-depth research into the markets with a focus on finding undervalued gold and silver mining companies. The Premium Membership includes the newsletter, real-time access to the model portfolio and email trade alerts whenever Jason is buying or selling. Click here for instant access!
Copyright © 2018 Gold Stock Bull - All Rights Reserved
All ideas, opinions, and/or forecasts, expressed or implied herein, are for informational purposes only and should not be construed as a recommendation to invest, trade, and/or speculate in the markets. Any investments, trades, and/or speculations made in light of the ideas, opinions, and/or forecasts, expressed or implied herein, are committed at your own risk, financial or otherwise. The information on this site has been prepared without regard to any particular investor’s investment objectives, financial situation, and needs. Accordingly, investors should not act on any information on this site without obtaining specific advice from their financial advisor. Past performance is no guarantee of future results.
© 2005-2022 http://www.MarketOracle.co.uk - The Market Oracle is a FREE Daily Financial Markets Analysis & Forecasting online publication.