


Stock Market Correction Ahead, But When?
Stock-Markets / Stock Markets 2018 Sep 16, 2018 - 08:48 AM GMTBy: Harry_Dent

 The broader stock market via the S&P 500 finally broke to new highs in August, while they drifted insignificantly lower on Wednesday.
And as Adam O’Dell recently commented, that typically means substantially higher highs ahead… like 13% plus.
What does this mean for my great crash forecast?
Well, my favored scenario right now, with the strong tax cuts Trump handed us, is that the great bubble peak comes in late 2019, not now.
There are also many indicators to support this, including my new 90-year “Great Reset and Bubble Buster Cycle,” which Andrew Pancholi, my co-author on Zero Hour, first suggested to me. I have since found more reasons to get serious about its importance.
It’s a cycle that brought us the two greatest resets since the Industrial Revolution: the first in 1873 to 1843, the second from 1929 to 1933.
But there are some indicators that suggest the possibility that markets don’t go a lot higher before they peak. The more trusted indicators of the past may not work that well now that massive government intervention has turned everything upside down. Markets are “not so free” anymore!
In the September Boom & Bust issue I discuss both scenarios and talk about the potential of a surprise crash just ahead. Let’s explore that a little now…
Bigger Than Before, But Not Imminent
The Smart Money Flow Index strongly suggests that we’re heading toward a larger crash than the prior two, but it’s not necessarily imminent. They have not been buying into the rally of 2018!
Goldman Sachs has a Bull/Bear Sentiment indicator that is now at an extreme 75% bullish reading. It hit a 70%-bullish level near the 2007 top and 72%-bullish level near the 2000 greater bubble top.
Both of these indicators warn of a major top coming, not a minor one.
But I’ve been warning this for years now, so this is nothing new!
Really, the question is: WHEN?!
There is a nearer-term indicator warning of at least a minor correction ahead, even though most stock indices have made new highs. This could just be another correction on the way up… but also, if it continues to build, it could be another warning of the larger crash ahead.
When stocks make new highs, the volatility indicator (VIX) tends to make new lows. When new lows in the VIX don’t confirm new highs in stocks, that is a divergence that suggests some level of correction is coming.
We’re seeing this divergence “starting” to form now, as the chart shows…
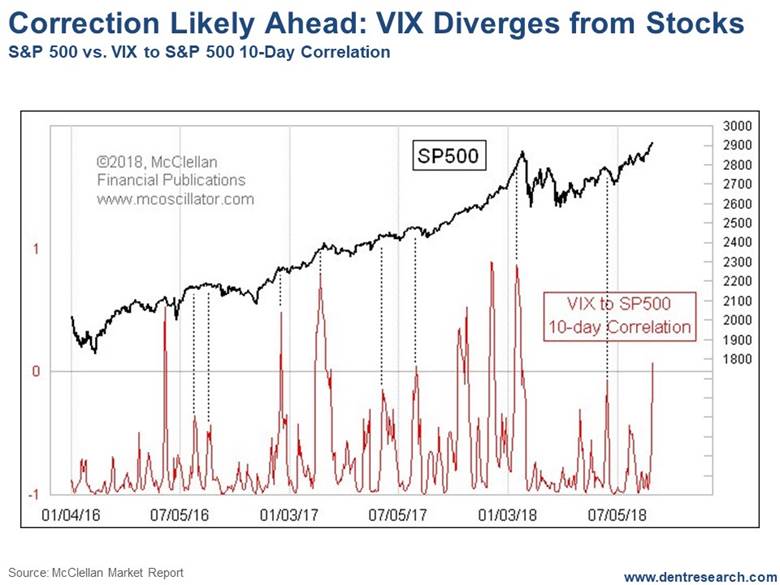
Most analysts typically look at periods when this happens, but Tom McClellan of the highly respected McClellan Oscillator indicator has come up with a better way to measure this divergence (and how it builds) more directly and obviously.
When his 10-day Correlation Indicator spikes up, it means lower volatility in the smart-trader options market is NOT confirming higher stock prices.
But, as you can see in the chart, such a counter market trend tends to build typically over three, or even four surges before it peaks, and stocks finally correct.
We’re only in the second surge right now. That’s why I emphasized “starting” to form before.
Possible Triggers…
My overall reading of these indicators (and more) is that we have at least a minor setback just ahead. But my more bullish scenario still favors Adam’s historical analysis of a near 15% rally ahead, well into 2019… a rally that could see the Dow hit as high as 30,000!
But we can’t ignore Trump’s political meltdown and legal storm or the trade wars… They’ll impact the markets… and maybe now, much sooner than later.
In this manipulated, un-free market, it’s going to take a few more months to get clearer indications on likely outcomes – especially after the mid-term elections. That’s why this is the theme of my presentation at this year’s Irrational Economic Summit in Austin, Texas (October 25-27).
It’s also why I discuss this in my September issue of Boom & Bust.
And it’s why I also focus more deeply on that 90-year great reset cycle in my upcoming issue of The Leading Edge, where I look more in depth at the most important issue facing investors: Are we about to peak near term in the final phase of the greatest stock bubble in history… or do we have a more minor correction in the next two to five months and then see the final peak on our now most powerful 90-year cycle around late 2019 (which would create a nearly identical event to the late 1929 to 1932 crash 90 years ago)?
That’s the trillion-dollar question for the U.S. and global economy!
It’s the million-dollar question for your family, investments, and business.
We’re going to be on this like a fly on… and when we see or hear anything that brings more clarity to this, we’ll let you know immediately.
Harry
Follow me on Twitter @HarryDentjr
Harry studied economics in college in the ’70s, but found it vague and inconclusive. He became so disillusioned by the state of the profession that he turned his back on it. Instead, he threw himself into the burgeoning New Science of Finance, which married economic research and market research and encompassed identifying and studying demographic trends, business cycles, consumers’ purchasing power and many, many other trends that empowered him to forecast economic and market changes.
Copyright © 2018 Harry Dent- All Rights Reserved Disclaimer: The above is a matter of opinion provided for general information purposes only and is not intended as investment advice. Information and analysis above are derived from sources and utilising methods believed to be reliable, but we cannot accept responsibility for any losses you may incur as a result of this analysis. Individuals should consult with their personal financial advisors.
© 2005-2022 http://www.MarketOracle.co.uk - The Market Oracle is a FREE Daily Financial Markets Analysis & Forecasting online publication.