


Will Stocks Keep Their Upward Momentum in October
Stock-Markets / Stock Markets 2018 Sep 30, 2018 - 03:02 PM GMT

VIX closed beneath Short-term resistance at 12.60, leaving it on a sell signal for a third week in a row. It appears to be in a holding pattern for the end of the quarter. However, the Cycles Model shows a likely surge in strength for the VIX through late October.
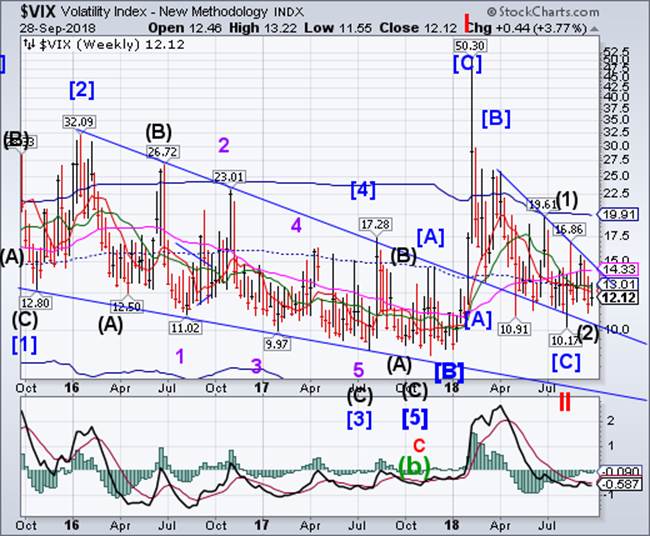
(MarketWatch) Stock-market investors should prepare themselves for a wild ride in coming weeks.
I say that not because I have any special insight into all the things that could sabotage the stock market in coming weeks—everything from an escalating trade war to political turmoil in Washington. Instead, my prediction is based on something far less inscrutable: The calendar.
October is just around the corner.
SPX reverses from its high.
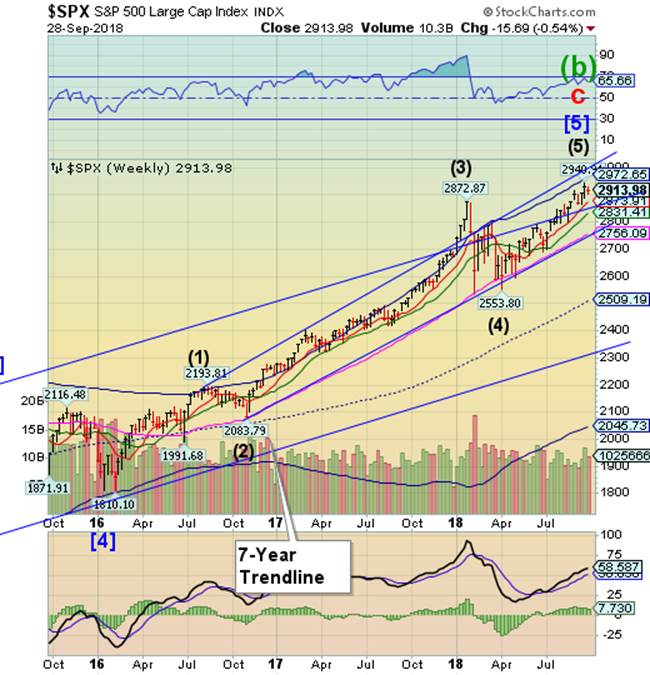
SPX reversed from its all-time high on September 21 exactly 18.5 years from its March 2000 high and has closed lower for the week. Both price and time targets appear to have been met. The Cycles Model now implies a powerful decline that may last through early November. The last time this has happened was in 2008.
(Bloomberg) Reading market forecasts for the November congressional elections, you get the sense something is missing.
Like, the market forecasts. While Wall Street is awash with efforts to frame outcomes as the vote approaches, there’s a discernible vagueness when you get to the part where strategists say what stocks will do. What’s causing this? Something to do with the last round of predictions, perhaps.
You may recall a certain trepidation in the air over how markets would receive a Donald Trump victory in November 2016. Forecasts for declines of 5 or 10 percent in the S&P 500 were common and 20 percent wasn’t unheard of. As everyone knows, they didn’t come true, and this time around strategists are leaving a wider margin for error.
NDX closes September without a new high.
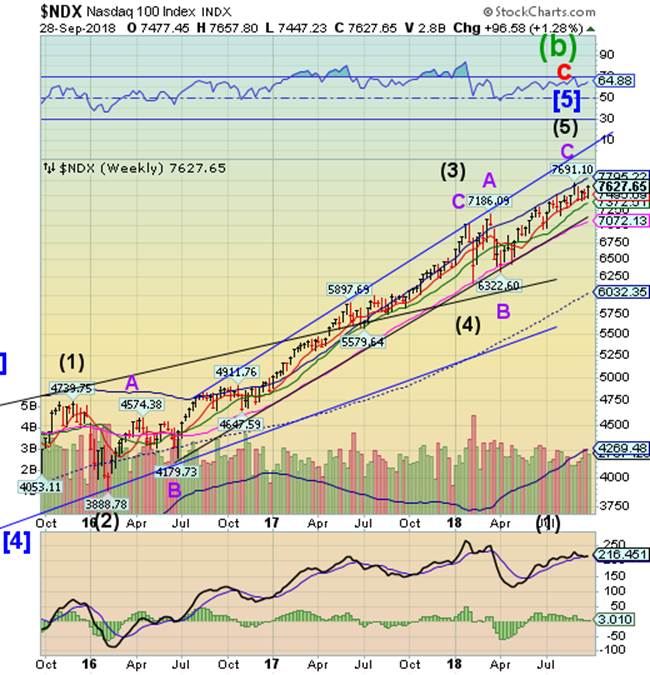
After a bad start of the month, NDX put in a lackluster performance by not making a new high in September. A decline beneath Short-term support at 7495.09 may trip the NDX sell signals. The Cycles Model suggests that the next several months may bring pain to equities. The weakest part of the Presidential Cycle often occurs in October. Will the NDX gain or lose strength as the election approaches?
(ZeroHedge) Among the major groups of stocks around the world that we follow, US small-cap stocks have been the best performer over the last decade as the USD experienced a strong bull market. US small caps have outperformed our mid/large group of developed companies by almost 40% over the last 10 years.
The relative performance has been highly correlated to the movement of the USD. US small caps made an intermediate high in April 2015 after the USD soared from about 80 to 100. They then tested this high in December 2016 as the USD once again reached new highs. Recently, as the USD was on the rise once again, small caps again tested their decade-long relative highs.
However, over the last few weeks, as the USD slowly rolled over, small caps are down about 3.5%.
High Yield Bond Index reverses beneath the trendline.
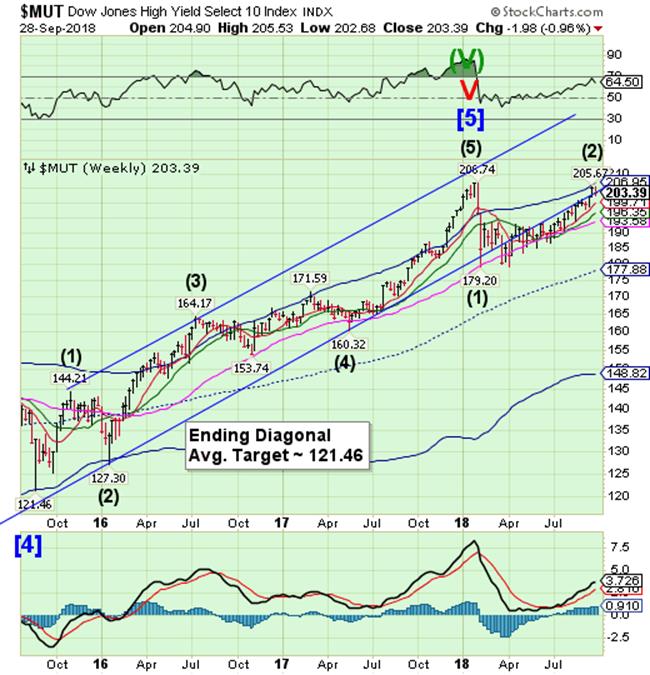
The High Yield Bond Index appears to have made its high on September 21. Since then it has declined beneath its 3-year trendline. A sell signal is confirmed beneath Intermediate-term support at 199.71. While this index has not made a new all-time high, several passive ETFs have made new highs.
(ZeroHedge) For the latest confirmation of the upside down market, look no further than corporate bonds where the riskiest, CCC-rated junk bonds are set to make a positive return for the 3rd consecutive year, the longest winning streak since records began in 1997.
Not only have the lowest quality junk bonds, those rated CCC or lower, generating respectable absolute returns of 5.8% YTD, they have also outperformed higher quality debt with a 1% total return so far this month, according to Bloomberg and ICE data. Additionally, the lowest rated junk bonds have also outperformed the broader junk bond index, which has returned 1.9% YTD.
UST due for a reversal.
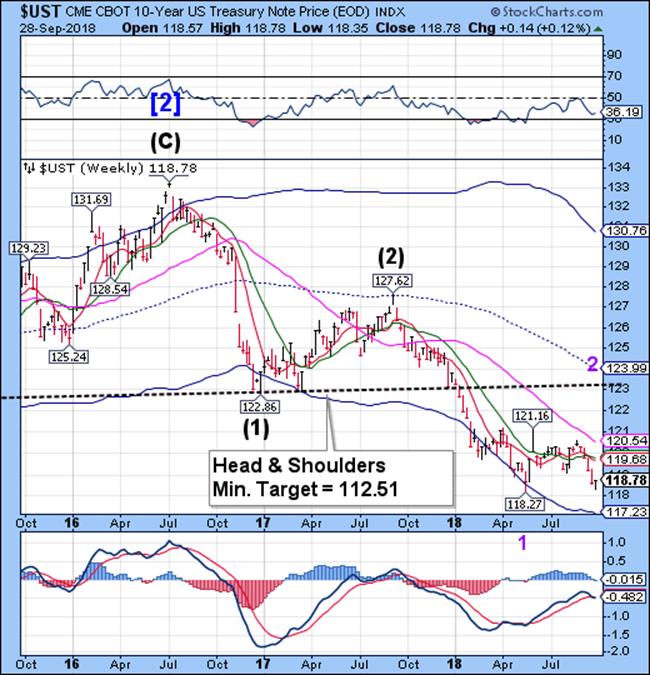
The 10-year Treasury Note Index appears to have made its Cycle low on September 25 at 118.35. From here we may see UST rally back toward the Head & Shoulders neckline near 123.00. This rally may be painful for the speculative short sellers in treasuries as it may induce short-covering.
(Forbes) Outspoken billionaire investor Jeff Gundlach garnered headlines recently highlighting that there was a “massive increase” in the number of investors short 10-year and 30-year U.S. Treasury bonds. As the DoubleLine Capital CEO observed, these short Treasury positions were the “highest for both in history.” “[It] could cause quite a squeeze,” he added.
We wholeheartedly agree.
Wall Street consensus has built a massive net short position across the entire Treasury bond curve. (See our table below showing the latest Wall Street consensus positioning data for all assets.)
The Euro pulls back.
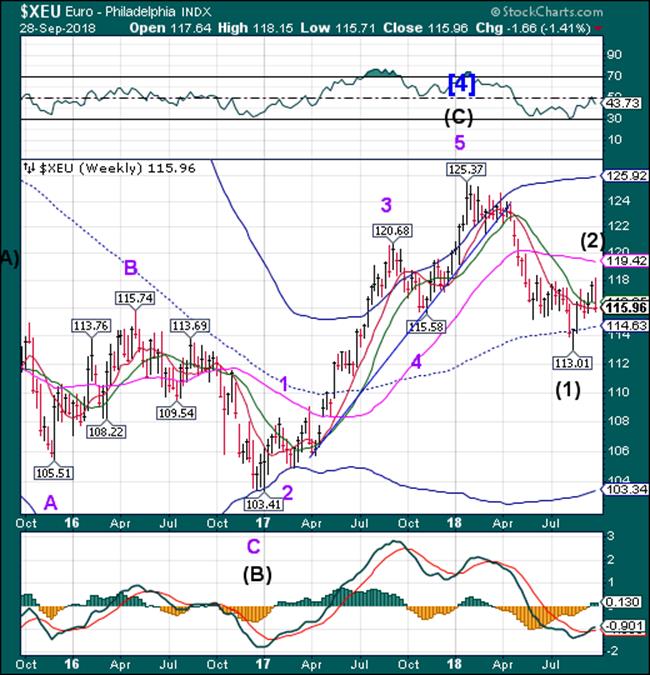
The Euro has reversed back down from a 41.5% retracement of its 2018 decline, finding enough buyers to close above Short-term support at 115.89. It appears capable of resuming its rally with a potential target near Long-term resistance at 119.42. If so, the rally may last for several weeks.
(Bloomberg) For all the European Central Bank’s signaling of an interest-rate “lift-off’’ next year, it might not get very far off the ground.
Some investors suspect even modestly higher borrowing costs will unleash a rally in the euro that undermines economic growth and curbs inflation. That could leave the currency bloc trapped with near-zero rates for years to come. Spillovers from a potential slowdown in the U.S., the world’s largest economy, may also weigh on the ECB’s scope to tighten policy.
The dilemma for central bankers is that the euro zone’s focus on exports and retrenchment in spending since the double-dip recession means that the bloc is now running a large current-account surplus. That puts upward pressure on the exchange rate, so far countered by the ECB’s ultra-loose monetary stance.
EuroStoxx fall short at Long-term resistance.
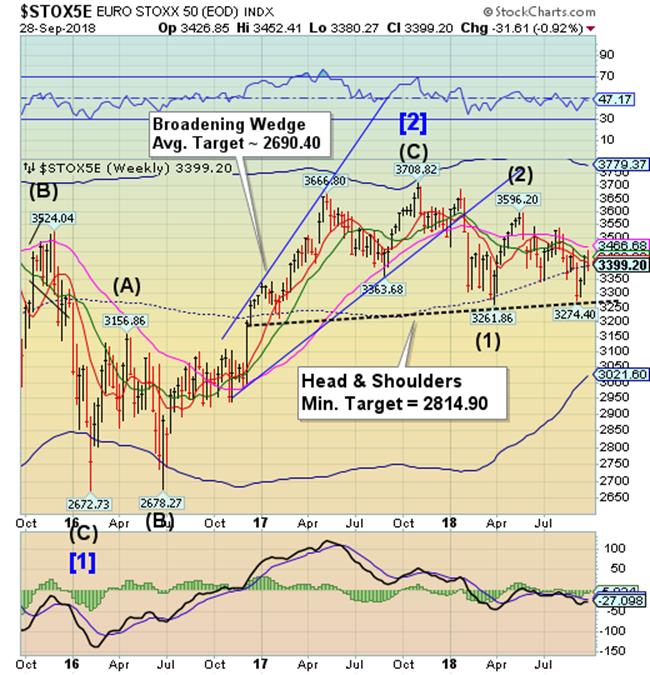
The EuroStoxx rose to test Long-term resistance this week, but reversed short of its target. Stoxx closed beneath mid-Cycle support at 3400.48, giving it a sell signal. The Cycles Model suggests a probable 4-week decline that may reach the Head & Shoulders target.
(CNBC) European markets were hit hard on Friday, as investors reacted to political turmoil in Europe and overseas.
The pan-European STOXX 600 closed 0.74 percent lower, with the majority of the region's sectors slipping into negative territory. Italy's FTSE MIB index tumbled more than 3.7 percent after Rome agreed to set a higher than expected budget deficit target that could put it on a collision course with Brussels.
Looking at sectors across the region, banks were worst performers on Friday, down around 2.6 percent with a number of Italian banks dropping to the bottom of the STOXX 600. Lenders including Unicredit, Banco BPM and Intesa Sanpaolo all fell more than 7 percent.
The Yen declining toward the trendline.
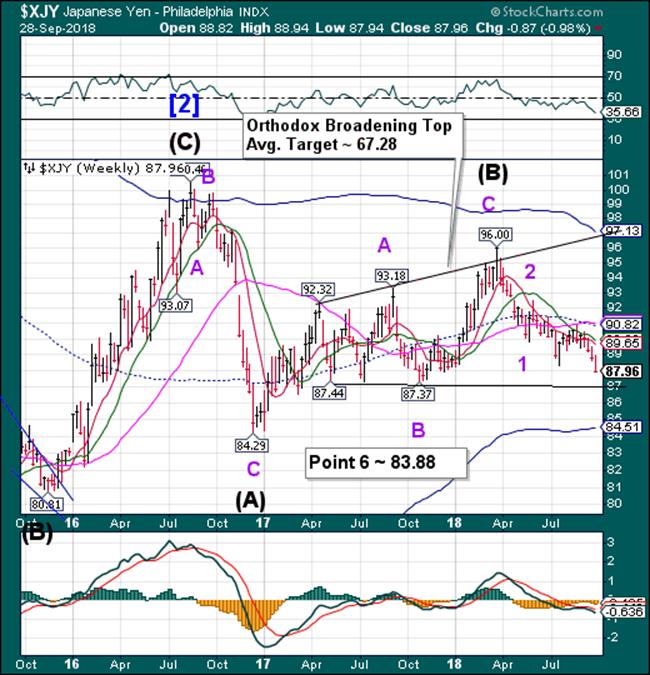
The Yen continued its decline toward the lower trendline of the Orthodox Broadening Top. The Cycles Model calls for a three week decline that may reach the proposed “point 6” in the structure of the Orthodox Broadening Top.
(DailyFX) The Japanese Yen remained under clear pressure against the US Dollar through the third quarter, with USD/JPY hitting highs not seen since mid-January. However, while interest-rate differentials between the two clearly present the Yen at clear disadvantage, there will be much more to its trading as 2018 bows out. It’s notable too that, despite those highs for USD/JPY, the pair leaves the quarter not much higher than where it started the period – or the year.
The impact of increasing hawkish Fed monetary policy bets and rising trade war fears certainly left their mark on USD/JPY prices. While progress has been slow, the break above the triangle top dating back to June 2015 suggests the uptrend from 2012 to 2015 could eventually be revived. To turn the market over to the bulls in earnest, USD/JPY needs to make more progress on the break of its three-year triangle than what was registered in the third quarter…
Nikkei makes a powerful inversion high.
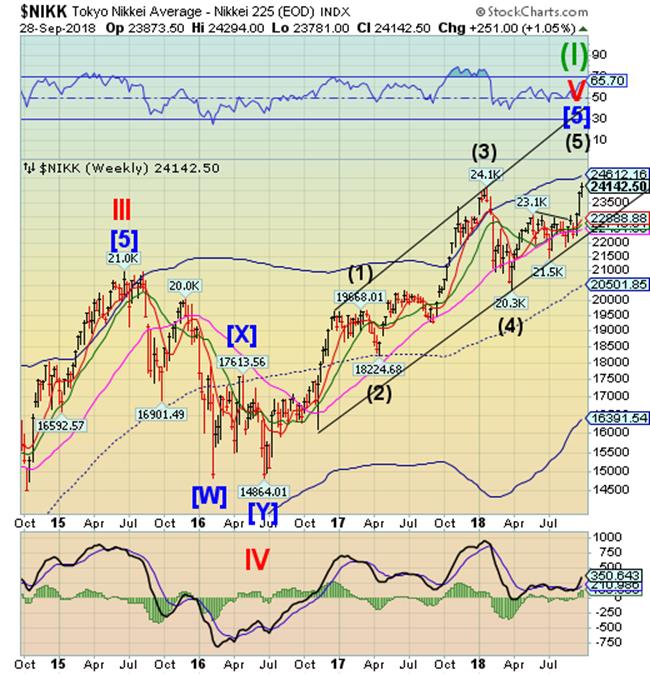
This week the Nikkei appears to have made a strength-filled, extended inversion high. An inversion occurs when the Cycle makes a high instead of the normal low. The Cycles Model calls for a sharp decline to follow, much like the sell-off beginning in late January.
(CNBC) Asia markets were largely positive on Friday, amid gains in Japan's Nikkei 225 which led the index to its highest intraday level in almost 27 years.
The Nikkei 225 closed higher by 1.36 percent at 24,120.04, with most sectors advancing. In the morning, the index saw its highest intraday levels since November 1991.
The moves in Japanese stocks came after the release of data that showed the country's unemployment rate fell 0.1 percent from the previous month to 2.4 percent. The country also saw an increase in its month-on-month industrial output in August, while retail sales in August was higher as compared to a year earlier.
U.S. Dollar bounces off a new pattern.
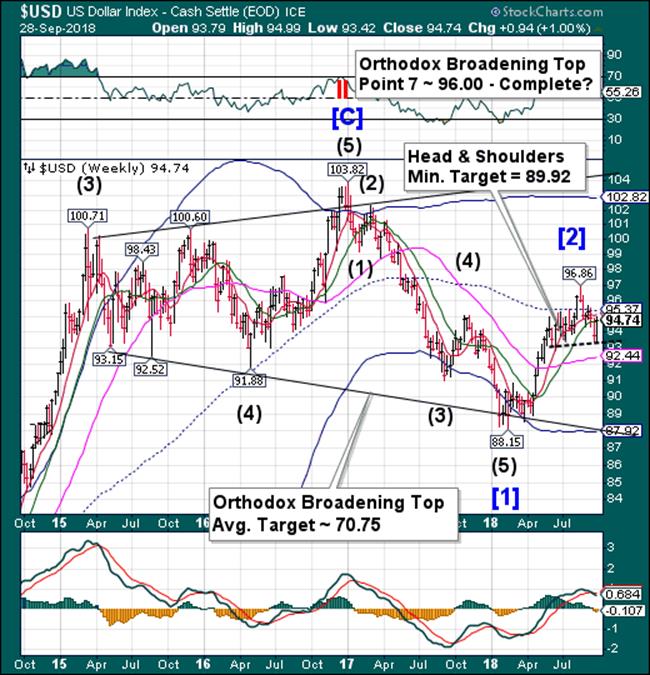
USD bounced this week, leaving a potential neckline of a new Head & Shoulders formation. The temporary strength for the bounce may now be dissipated, allowing the decline to resume. The Cycles Model calls for a bearish month of October which may see the Cycle Bottom and Broadening Top trendline broken.
(Reuters) - The dollar climbed to a two-week peak versus a basket of currencies on Friday, boosted by gains against the euro amid concerns about the Italian budget and a U.S. interest rate outlook that reflects multiple rate hikes until 2020.
The U.S. dollar also rose to a nine-month high against the yen.
As the third quarter winds down, the dollar index, a gauge of its value against six major currencies, was on track to post its second consecutive quarterly gain of about 0.7 percent. For the last six months, the greenback has advanced nearly 6 percent.
“The U.S. dollar remains a metaphorical rock in a sea of troubles,” said Karl Schamotta, director of global product and market strategy at Cambridge Global Payments in Toronto.
.Gold may break out of its decline.
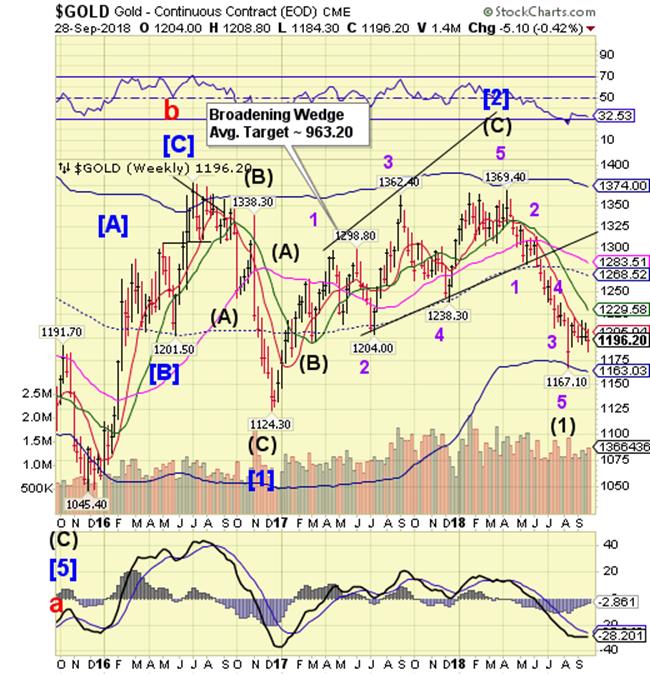
Gold closed beneath Short-term resistance at 1205.04, but may be ready for a breakout above it. The Cycles Model calls for a potential inversion high by mid-October. The next resistance is at 1229.28, but the rally may run to the mid-Cycle resistance at 1268.52.
(CNBC) Gold hit a fresh six-week low on Friday as the dollar firmed after upbeat U.S. economic data supported the Federal Reserve's resolve for steady interest rate hikes, putting the metal on track for its longest monthly losing streak since January 1997.
Gold was down about 1.6 percent in September, its sixth straight monthly loss.
Spot gold rose 0.9 percent to $1,192.53 an ounce. The metal touched its lowest since Aug. 17 at $1,180.34 an ounce earlier in the session, dipping further from a six-week low of $1,181.61 hit on Thursday.
U.S. gold futures rose 0.7 percent at $1,196.10 an ounce.
Crude rallies to the upper Diagonal trendline.
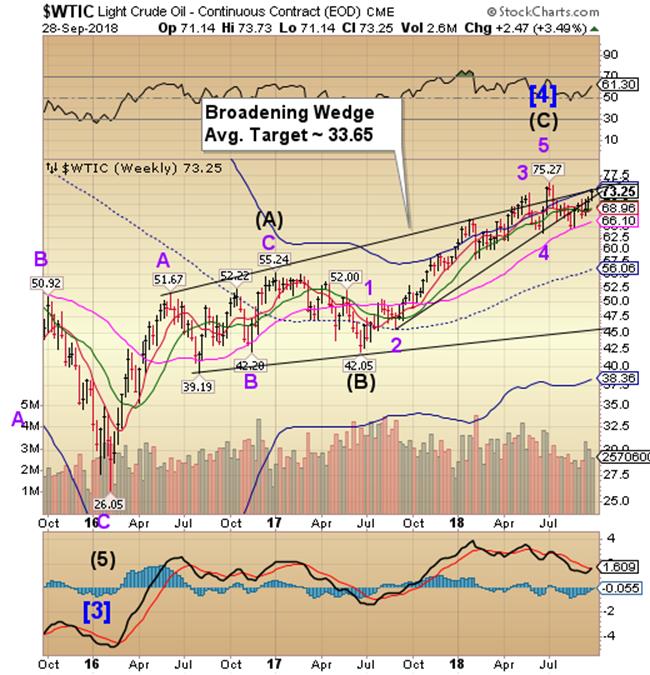
Crude rallied on a triple indication of strength through the week to the Diagonal trendline and Cycle Top at 73.76. While the strength may extend a few more days, the Cycles Model now calls for a decline through mid-October.
(S&PGlobalPlatts) Crude oil futures were stable to higher in mid-morning trade in Asia Friday as market participants continued to focus on the impact of the looming loss of crude barrels due to the reimposition of US sanctions on Iran.
At 11:15 am Singapore time (0315 GMT), ICE November Brent crude futures were unchanged from Wednesday's settle at $81.72/b, while the NYMEX November light sweet crude contract was 14 cents/b (0.19%) higher at $72.26/b.
"Further concerns over Iranian oil supplies continue to lift oil prices," OCBC commodity economist Barnabas Gan said.
Shanghai Index rallies above the Cycle Bottom.
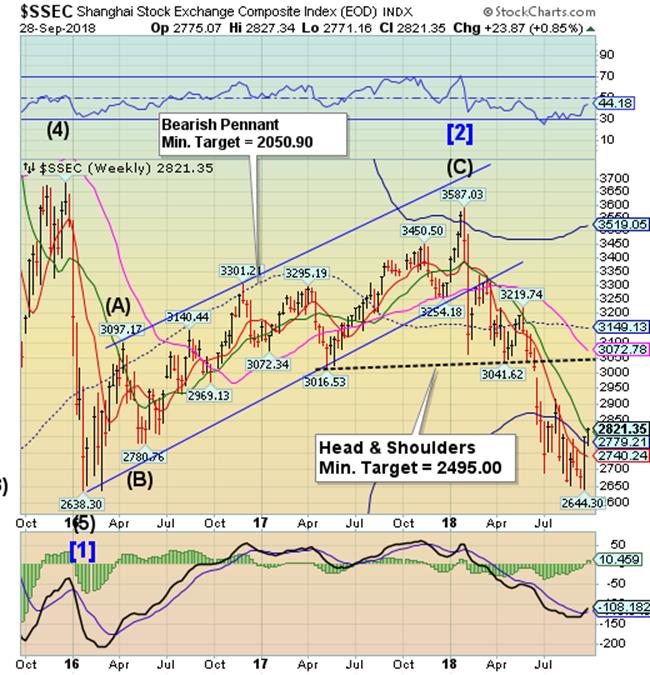
The Shanghai Index rallied above its Cycle Bottom resistance and closed above Intermediate-term support/resistance at 2809.98. It is likely that may be another probe higher over the next week or more. Should that be the case, the rally may attempt to reach the Head & Shoulders neckline near 3050.00.
(Reuters) - Global index provider FTSE Russell said it will start including mainland Chinese shares in its major benchmarks from June next year, in a move that it expects will draw initial net inflows of $10 billion from passive investors.
The decision on Wednesday to include China’s so-called A-shares in its widely followed global benchmarks follows three straight years of the group rejecting their admission on concerns about market access limits.
The FTSE Russell decision represents another win for the country’s market regulator after the historic inclusion of mainland stocks in MSCI Inc’s share indexes in June.
The Banking Index at the neckline.
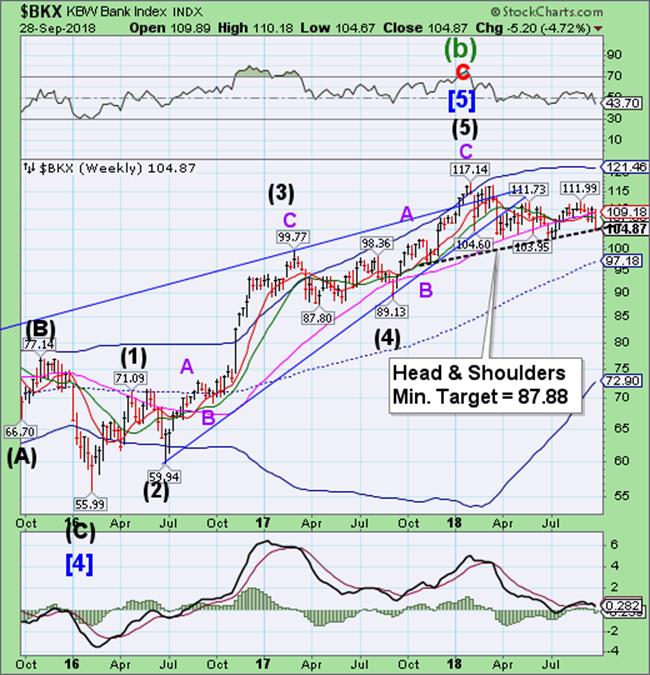
-- BKX declined to its Head & Shoulders neckline at 104.90 on Friday. BKX has already declined through critical support at 109.00 and is on a sell signal. Should it break through at the beginning of the week, there may be a panic decline for the next month. If the neckline holds, a brief bounce is in order with a delayed decline.
(ZeroHedge) Ten years after the crisis, financial regulation leaves taxpayers holding the bag for banks’ safety net...
Regulation is best understood as a dynamic game of action and response, in which either regulators or regulatees may make a move at any time. In this game, regulatees tend to make more moves in pursuit of safety-net subsidies than regulators can or do make to stop them. Moreover, regulatee moves tend to be faster and more creative, and to have less-transparent consequences than the moves that regulators make.
In modern times, banking crises have occurred when managers pursued concentrated risks that made their institutions increasingly vulnerable, but generated a series of substantial and long-lasting safety-net subsidies until things finally went south. As I explore in my new INET working paper, such subsidies can prove long-lasting because the regulatory cultures of almost every country in the world today embrace—in one form or another—three strategic elements:
- Politically-Directed Subsidies to Selected Borrowers: The policy framework either explicitly requires—or implicitly rewards—institutions for making credit available to favored classes of borrowers at a subsidized interest rate. In recent crises, subsidized loans to homeowners played this role. However, the next crisis may feature loans to current and former students, pension funds, and state and local entities;
- Subsidies to Bank Risk-Taking: The policy framework commits government officials to offer on subsidized terms explicit and/or implicit (i.e., conjectural) guarantees of repayment to banks’ depositors and other kinds of counterparties engaging in complex forms of bank deal making;
- Defective Monitoring and Control of the Subsidies: The contracting and accounting frameworks used by banks and government officials leave no paper trail. They are careful not to make anyone directly accountable for reporting or controlling the size of these subsidies in a conscientious or timely fashion.
(WSJ) Bank stocks just suffered their worst week in six months, the latest sign that investors remain cautious on the financial sector even as the U.S. economy grows at the fastest pace in years.
The S&P 500 financials sector fell 4% in the past week, its worst period since March 23, to trim all of its 2018 gains. The decline comes after the group hit a six-month high Sept. 20. The more narrow KBW Bank index of 24 bank stocks has also struggled, lagging behind as the broader stock market has hit fresh records.
The underperformance of financial stocks after the group rose 20% in 2016 and 2017 shows that investor worries about the global economy continue to hang over the latest leg of the bull market, analysts say.
(Bloomberg) Australia’s long-running inquiry into its financial industry lambasted a runaway culture of greed and poor behavior but stopped short of recommending any penalties, sending bank shares rallying.
The wrongdoing was too often driven by greed or “the pursuit of short-term profit at the expense of basic standards of honesty,” the inquiry led by Commissioner Kenneth Hayne said in its interim report released in Canberra Friday. “The banks have gone to the edge of what is permitted, and too often beyond that limit, in pursuit of profit.”
Since public hearings began in March, the government-appointed Royal Commission has unearthed a string of scandals, including wealth advisers charging dead people for services, lying to regulators about misconduct, and loan officers accepting bribes. In his wrap-up of the evidence so far, Hayne slammed the banks’ culture, conduct, compliance and remuneration practices and criticized regulators for a timid approach.
Regards,
Tony
Our Investment Advisor Registration is on the Web.
We are in the process of updating our website at http://mrpracticalinvestor.com/ to have more information on our services. Log on and click on Advisor Registration to get more details.
If you are a client or wish to become one, please make an appointment to discuss our investment strategies by calling Connie or Tony at (517) 699-1554, ext 10 or 11. Or e-mail us at tpi@thepracticalinve4stor.com .
Anthony M. Cherniawski, President and CIOhttp://mrpracticalinvestor.com
As a State Registered Investment Advisor, The Practical Investor (TPI) manages private client investment portfolios using a proprietary investment strategy created by Chief Investment Officer Tony Cherniawski. Throughout 2000-01, when many investors felt the pain of double digit market losses, TPI successfully navigated the choppy investment waters, creating a profit for our private investment clients. With a focus on preserving assets and capitalizing on opportunities, TPI clients benefited greatly from the TPI strategies, allowing them to stay on track with their life goals.
Disclaimer: The content in this article is written for educational and informational purposes only. There is no offer or recommendation to buy or sell any security and no information contained here should be interpreted or construed as investment advice. Do you own due diligence as the information in this article is the opinion of Anthony M. Cherniawski and subject to change without notice.
Anthony M. Cherniawski Archive |
© 2005-2022 http://www.MarketOracle.co.uk - The Market Oracle is a FREE Daily Financial Markets Analysis & Forecasting online publication.