


Stock Market’s Breadth is Weak: Stocks Will Crash! Just Kidding
Stock-Markets / Stock Markets 2018 Oct 05, 2018 - 08:15 AM GMTBy: Troy_Bombardia

 We’ve done 2 kinds of stock market studies recently.
- The U.S. stock market’s own price action.
- The U.S. stock market’s breadth.
Market studies related to the stock market’s own price action have mostly been bullish.
Market studies related to the stock market’s breadth have been mixed. Some are bullish, while others are very bearish.
So what gives? Why are some breadth studies so bearish? (e.g. Hindenburg Omen)
If you read the mainstream financial media’s headlines, it seems like the stock market is going to crash because “breadth is very weak”. They all sound something like this:
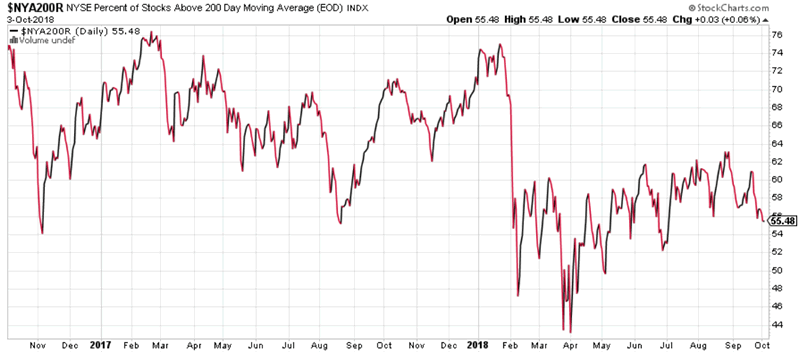
- The stock market (e.g. Dow) is going up, but most of the NYSE’s stocks are in a bear market! (Below their 200 dma).
- The Dow closed at an all-time high. However, 3x as many stocks on the NYSE hit 52 week lows vs 52w highs! Before, this only happened in December 1999!
Seems super bearish doesn’t it? I’ll admit, I kind of got sucked into this trap recently. But a little voice kept ringing in the back of my mind. “How is this possible? If most stocks are going down, and FANG stocks have been falling recently, who the hell is going up”? This is a purely mathematical question about how averages work.
Turns out “most stocks are going down right now” is a highly misleading statement.
I’ve reflected on a lot of market studies from 2017. Pretty much all the FAILED bearish studies were of the exact same sort: these “bearish NYSE breadth” studies.
*Breadth was flashing a super bearish sign every single month from January – December 2017. Meanwhile the stock market rallied incessantly.
So why have breadth indicators failed consistently over the past few years?
Never let the truth get in the way of a good story
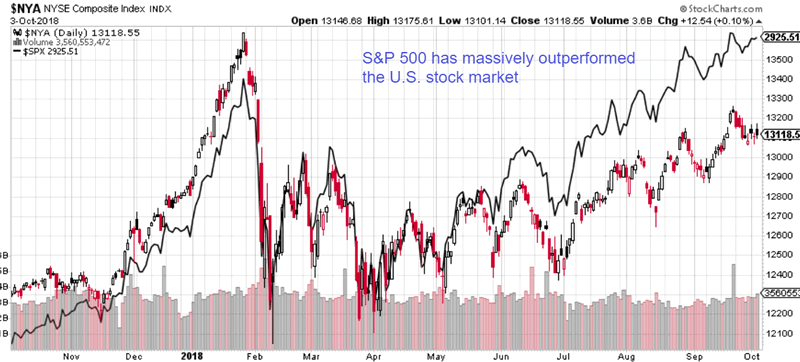
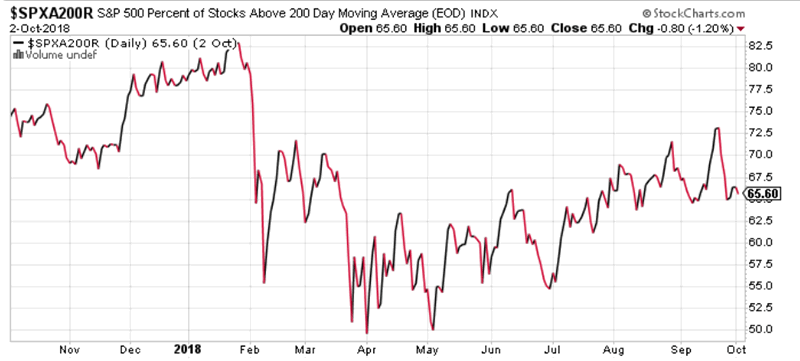
Why is it that the NYSE’s breadth is so “bad” (only 55% of NYSE stocks are above their 200 dma) while 65% of the S&P 500’s stocks are above their 200 dma?
Because the NYSE no longer best reflects “the U.S. stock market”.
The NYSE Index covers over 2000 stocks. More than 1600 are from U.S. corporations and over 360 are from foreign corporations. HOWEVER, foreign companies are very prevalent among the largest companies in the index. Of the 100 largest (by market cap), 55% are non-U.S. companies.
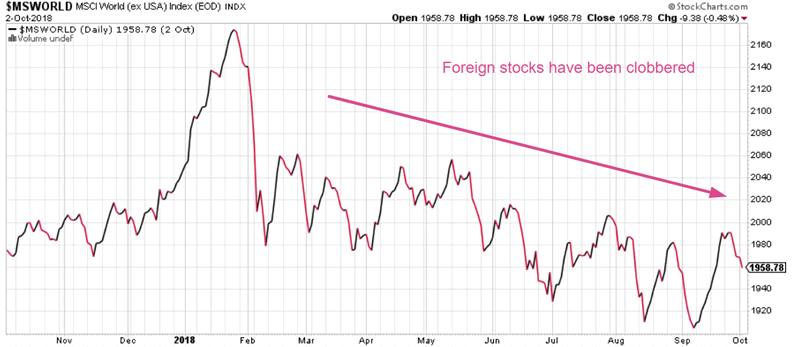
So straight away, you can see that the NYSE’s doesn’t accurately reflect the “U.S. stock market”. In a year like 2018 during which foreign stocks are being clobbered, it’s clear why the NYSE lags the S&P 500 so much (and why the NYSE’s breadth is so much worse than the S&P 500’s breadth).
Only 55% of NYSE stocks are above their 200 dma.
While 65% of S&P 500 stocks are above their 200 dma.

So why is it that in the past, these kinds of bearish NYSE breadth divergences marked the 2000 and 2007 tops? (more common during 1999 – 2000)
Because the world has changed
In the past (pre-2008), the NYSE mostly listed U.S. stocks. But with the advent of globalization, more and more foreign stocks are being listed on U.S. exchanges (e.g. Alibaba). This coincides with the rise of China. A lot of Chinese and foreign companies have listed their stocks on U.S. exchanges over the past 10 years (think Alibaba, Baidu, Tencent).
- Before the GFC, these breadth divergences in the NYSE accurately reflected breadth divergences in the “U.S. stock market”.
- Today, more and more “breadth divergences” in the NYSE reflect a divide between U.S. and foreign stocks. It doesn’t tell you much about breadth divergences in the U.S. stock market itself.
Year to date, foreign stocks have been slaughtered by Trump’s trade war while the U.S. stock market has gone up.
Looking at the actual data
Holy shit! Over the past few days, there were 3x more issues on the New York Stock Exchange that made 52 week lows vs. the number of issues that made 52 week highs!
These kinds of statements are very popular on financial media and fintwit, because everyone loves a good story about “how the stock market’s breadth is super weak and stocks will crash”.
But how many of these people have actually seen WHY breadth is “so weak”?
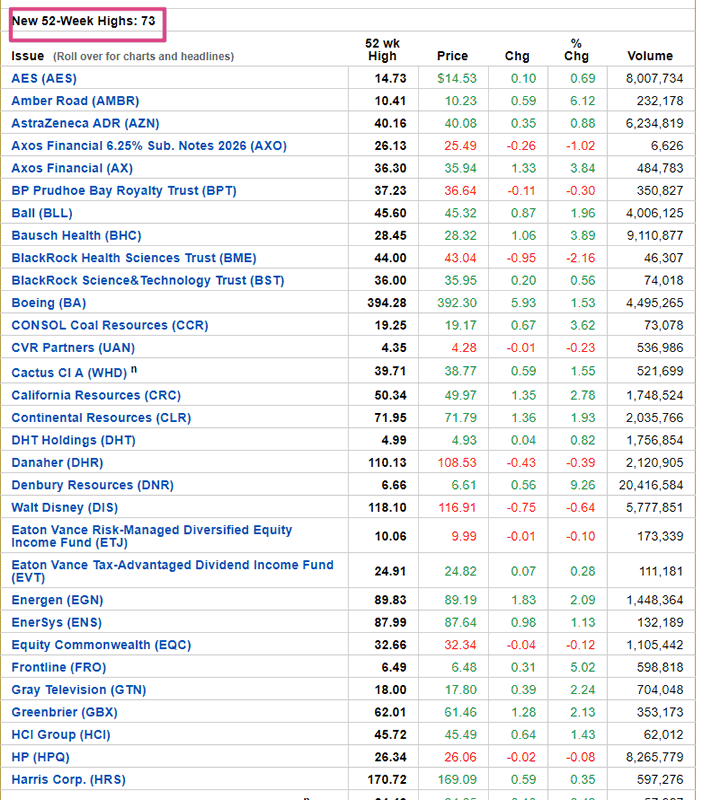
Here’s a glance at the actual data:
52 week highs
52 week lows
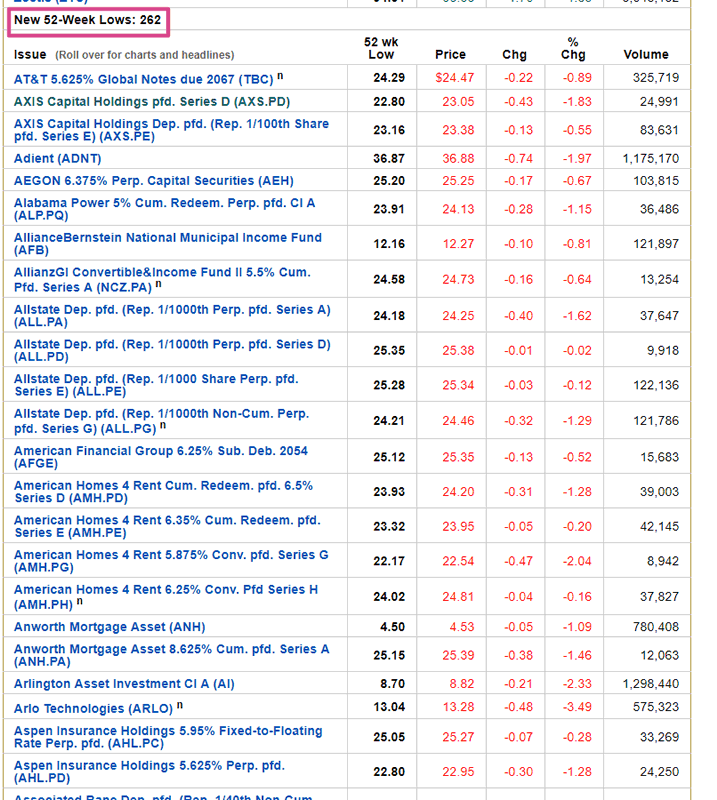
What do you see?
- The issues making 52 week highs are mostly stocks.
- The issues making 52 week lows are mostly bond funds and preferred.
As you can see, this isn’t exactly a “stock market breadth divergence”. This is more of a “stocks are going up while bonds are going down” divergence.
This is easy to understand. Bond prices are falling right now because interest rates are going up.
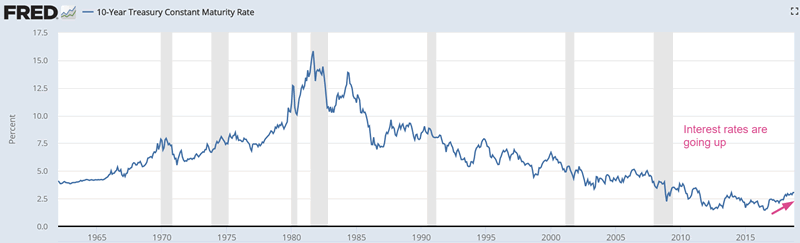
And as we’ve demonstrated in the past, rising interest rates aren’t bearish for the stock market. The stock market goes up more often than it goes down when interest rates rise.
Conclusion
So there you have it. Saying that “the stock market’s breadth is weak” because “the NYSE’s breadth is weak” is misleading. The NYSE doesn’t accurately reflect “the U.S. stock market”.
- Over the years, the NYSE is increasingly weighed down by foreign (non-U.S.) stocks.
- The NYSE has a lot of bond funds that fall when interest rates are rising.
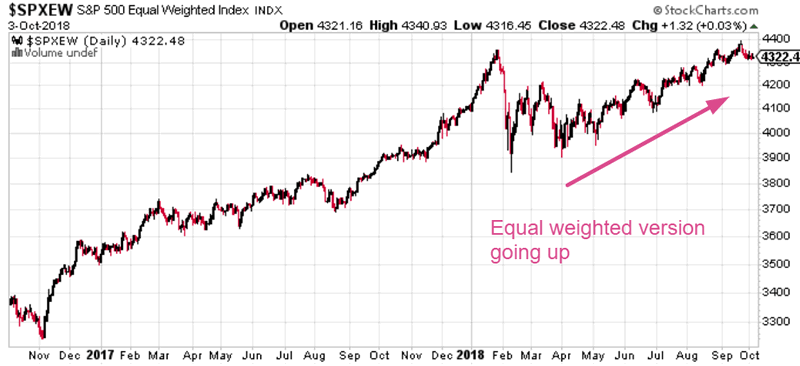
The most accurate breadth indicator for the “U.S. stock market” = “the % of S&P 500 stocks that are above their 200 dma”. And right now, most S&P 500 stocks are above their 200 dma. Otherwise the equal-weighted version of the S&P 500 wouldn’t be rising as well. (That’s pretty much how averages work).
Lessons
Lesson #1
The first lesson is simple. Never take things at face value. Always dig a little deeper. Financial media has an incentive to sensationalize everything. After all, why let the truth get in the way of a good story, when a good story gets more eyeballs and attention? Compare these 2 headlines. Which do you think will get more clicks on CNBC?
- Here’s why the stock market will go up 7% next year.
- Here’s why the stock market will crash -30% next year.
Lesson #2
The second lesson is more technical. Going forward, I am going to post fewer of these market studies about breadth and post more market studies about the U.S. stock market’s (S&P 500’s) own price action.
Breadth indicators tend to give a LOT of false bearish signals. With so many breadth indicators out there, there will always be some that send bearish signals. I admit that I have fallen a little into this trap lately, so I am correcting myself now.
Lesson #3
For U.S. stock market breadth indicators, focus on indexes instead of exchanges. The S&P 500 includes AMERICAN companies. The NYSE and NASDAQ have a lot of foreign stocks (e.g. Baidu, Alibaba).
Times change, which means that the nature of various indicators change. The NYSE Index no longer reflects “the U.S. stock market” the way it used to.
Lesson #4
Be wary of market studies with limited data. You see this a lot:
“The stock market is doing XYZ right now. Since 1995-present, XYZ has only happened in 1999 and 2007”.
While this may have occurred in 1999 and 2007, it might have also occurred before a lot of big rallies in the 1980s and 1990s. Permabears love to use only data after 1999 because it increases the probability of a “bear market study”.
More data is always better than less.
Lesson #5
Ignore financial dogma, and examine the facts for yourself
Click here for more market studies
By Troy Bombardia
I’m Troy Bombardia, the author behind BullMarkets.co. I used to run a hedge fund, but closed it due to a major health scare. I am now enjoying life and simply investing/trading my own account. I focus on long term performance and ignore short term performance.
Copyright 2018 © Troy Bombardia - All Rights Reserved
Disclaimer: The above is a matter of opinion provided for general information purposes only and is not intended as investment advice. Information and analysis above are derived from sources and utilising methods believed to be reliable, but we cannot accept responsibility for any losses you may incur as a result of this analysis. Individuals should consult with their personal financial advisors.
© 2005-2022 http://www.MarketOracle.co.uk - The Market Oracle is a FREE Daily Financial Markets Analysis & Forecasting online publication.