


US Stocks Mount Impressive Early Recovery
Stock-Markets / Stock Markets 2018 Oct 17, 2018 - 03:37 PM GMTBy: Chris_Vermeulen

 As fast as the downside breakout occurred, the upside recovery appears to be taking place as Q3 Earnings begin to hit the news wires. This past weekend, the news cycles and market experts all seemed to have opinions about where the US equities market was headed after last week’s price collapse. We’ve read everything from warnings of a $20 trillion dollar collapse to seeing Bloomberg’s SMART INDEX chart showing equity valuations are near historic market bottoms. It seems everyone wanted to get out and share their opinions – I guess we are no different.
The facts still remain the same, until the global market dynamics change and the US equities markets break the defined price channels that have been well established, we do not see any reason to consider a 6~8% correction life-threatening. In the total scope of the price range, this move represents less than a 25% price correction from price rotation points (as you’ll see on the longer term NQ chart below). Yes, eventually, some critical market event might cause the US equity markets to change direction, but until then stay safe and roll in and out of trades with skill.
Our research team, at Technical Traders Ltd., has continued to stay on top of this move by predicting the downside move over 3 weeks before it happened and by calling the bottom near 2700 on the ES. Recently, we posted two articles regarding the Q3 earnings expectations and the longer term price channels that are defining this current move. We suggest you visit www.TheTechnicalTraders.com to read our most recent research posts.
The recent upside price swing in the US Equities markets should not have been a surprise if you had been following our analysis and research. These types of price rotation are actually very healthy for the price and allows the price to establish support, wash out a few weaker positions and allows skilled traders to position themselves for future success.
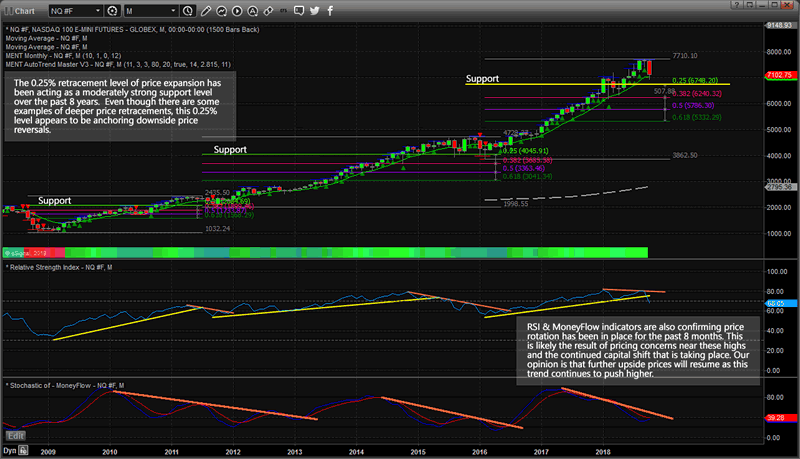
This Monthly NQ chart shows you what our research team has identified as a price pattern going back 8+ years. Since the 2009-10 bottom in the markets, price rotation has been limited to about 0.25% total retracements for each upward price range. This is interesting in the sense that rotation is occurring in price, but it has historically been somewhat limited to within the 0.25% range. This also suggests that as price continues to climb and expand, the 0.25% retracement range is also expanding.
Still, until we see a deeper price retracement that clearly breaches support channels and confirms a downside move, we don’t believe any real danger exists to the downside. We have advised our members appropriately to watch for this move and protect their open long positions as this downside setup was identified by our team over 4 weeks ago. Now, we are advising our members to take advantage of strategic opportunities in selected symbols because of what our predictive modeling systems are suggesting.
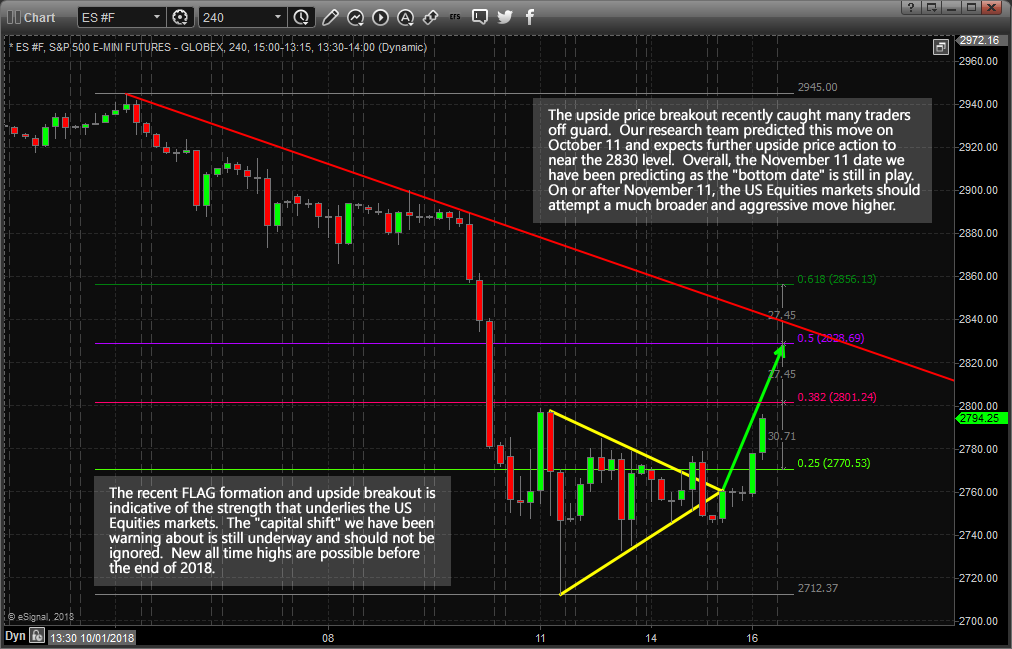
This 240 minute ES chart shows the recent upside breakout of the FLAG/Pennant formation near the support levels (2733~2744). These levels were identified by our research team shortly after the bottom had formed and allowed us to understand that as long as price stayed above these levels, an upside price breakout was the strongest possibility. The “washout” price rotation near the apex of the FLAG formation was expected as well. Our team believes the upside price move is just starting and that price will move to near 2830 before stalling and potentially retracing back to near 2785. Remember, our research shows that a true price bottom will not form in the US markets will somewhere near November 8~12. Somewhere near these dates, the US Equities market should form a very solid price bottom and begin to really accelerate to the upside throughout the end of 2018.
We’ve already positioned our subscribers to effectively profit from the future moves we expect in the markets. Our predictive modeling systems are showing us what is the highest probability outcomes and our job is to keep our subscribers well informed and ahead of these moves. We urge you to spend a bit of time reviewing our most recent research posts to better understand the current market environment: visit www.TheTechnicalTraders.com/FreeMarketResearch/ to access all of our public research posts. The Christmas rally should be setting up very quickly and this Q3 earnings season is likely to present some very good trading opportunities. Get ready for 2019 by following our research and staying ahead of these market moves instead of following along after the moves have taken place.
Chris Vermeulen
www.TheTechnicalTraders.com
Chris Vermeulen has been involved in the markets since 1997 and is the founder of Technical Traders Ltd. He is an internationally recognized technical analyst, trader, and is the author of the book: 7 Steps to Win With Logic
Through years of research, trading and helping individual traders around the world. He learned that many traders have great trading ideas, but they lack one thing, they struggle to execute trades in a systematic way for consistent results. Chris helps educate traders with a three-hour video course that can change your trading results for the better.
His mission is to help his clients boost their trading performance while reducing market exposure and portfolio volatility.
He is a regular speaker on HoweStreet.com, and the FinancialSurvivorNetwork radio shows. Chris was also featured on the cover of AmalgaTrader Magazine, and contributes articles to several leading financial hubs like MarketOracle.co.uk
Disclaimer: Nothing in this report should be construed as a solicitation to buy or sell any securities mentioned. Technical Traders Ltd., its owners and the author of this report are not registered broker-dealers or financial advisors. Before investing in any securities, you should consult with your financial advisor and a registered broker-dealer. Never make an investment based solely on what you read in an online or printed report, including this report, especially if the investment involves a small, thinly-traded company that isn’t well known. Technical Traders Ltd. and the author of this report has been paid by Cardiff Energy Corp. In addition, the author owns shares of Cardiff Energy Corp. and would also benefit from volume and price appreciation of its stock. The information provided here within should not be construed as a financial analysis but rather as an advertisement. The author’s views and opinions regarding the companies featured in reports are his own views and are based on information that he has researched independently and has received, which the author assumes to be reliable. Technical Traders Ltd. and the author of this report do not guarantee the accuracy, completeness, or usefulness of any content of this report, nor its fitness for any particular purpose. Lastly, the author does not guarantee that any of the companies mentioned in the reports will perform as expected, and any comparisons made to other companies may not be valid or come into effect.
Chris Vermeulen Archive |
© 2005-2022 http://www.MarketOracle.co.uk - The Market Oracle is a FREE Daily Financial Markets Analysis & Forecasting online publication.