


Why the Stock Market Will Pullback, Rally, and Roll Into a Bear Market
Stock-Markets / Stock Markets 2018 Nov 13, 2018 - 10:26 AM GMTBy: Troy_Bombardia

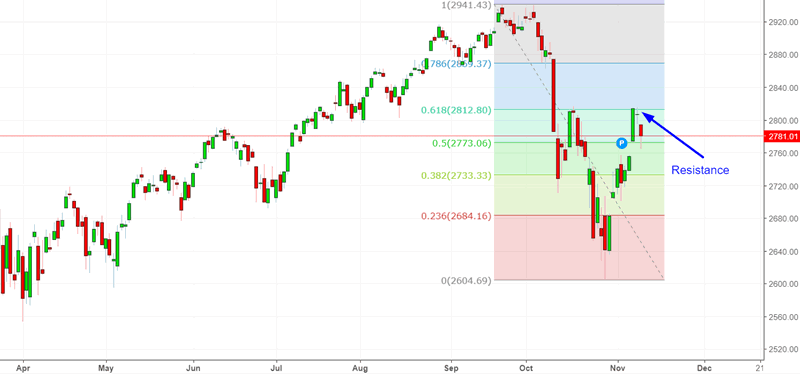
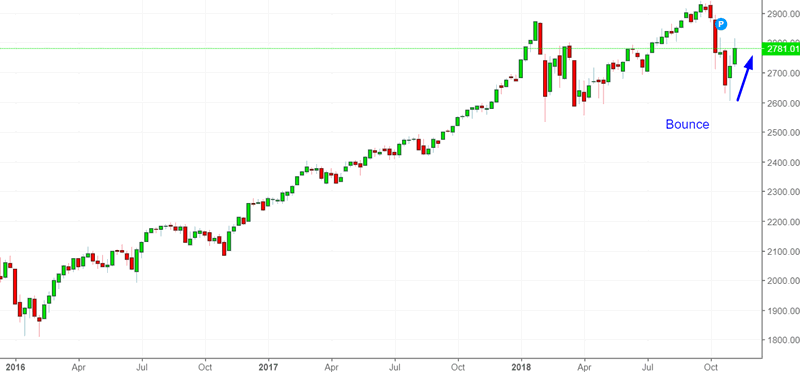
The S&P 500 has made a 61.8% retracement and is now stalling. This is completely normal. Most 10%+ corrections have a 61.8% retracement and then a pullback or retest of the lows before heading higher.
The economy’s fundamentals determine the stock market’s medium-long term outlook. Technicals determine the stock market’s short-medium term outlook. Here’s why:
- The stock market’s long term is bullish. The bull market will probably peak in Q2 2019.
- The stock market’s medium term is bullish.
- The stock market’s short term leans bearish.
We focus on the medium and long term. Let’s go from the long term, to the medium term, to the short term.
Long Term
Our long term outlook remains bullish. This bull market will probably last until Q2 2019, after which a bear market will ensue.
The economy and the stock market move in the same direction in the long term. Hence, leading economic indicators are also long term leading stock market indicators.
Most leading indicators are still improving. However, the economy is close to “as good as it gets”, which suggests that it’ll start to deteriorate in 2019.
While corporate Unit Profits went up this quarter, they have been trending downwards for a few years. This suggests that we are certainly late-cycle in this bull market.
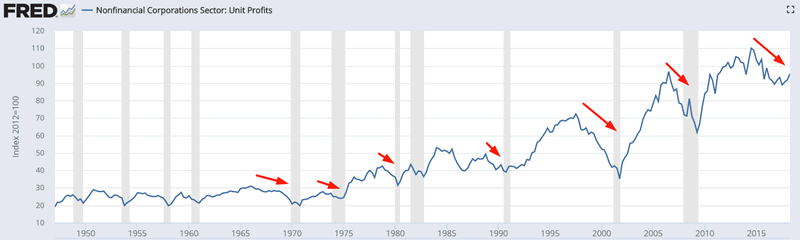
Source: FRED
Heavy Truck Sales continue to trend upwards. Historically, Heavy Truck Sales trended downwards before bear markets and recessions began.
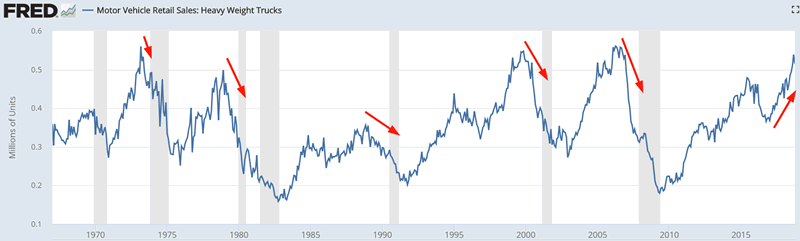
Source: FRED
Initial Claims is trending sideways while Continued Claims is trend downwards. Historically, these 2 data series trended upwards before bear markets and economic recessions began.
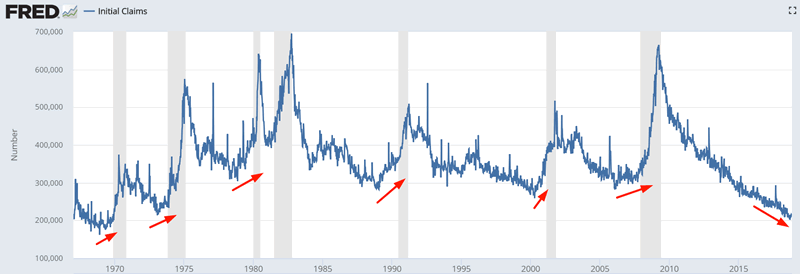
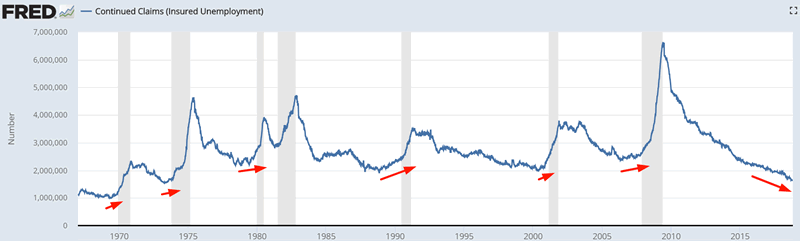
Source: FRED
Net Earnings Revisions are still positive. Historically, Net Earnings Revisions fell to zero when bear markets and recessions began. This figure will continue to fall in the next few months and will most likely turn negative in mid-2019.
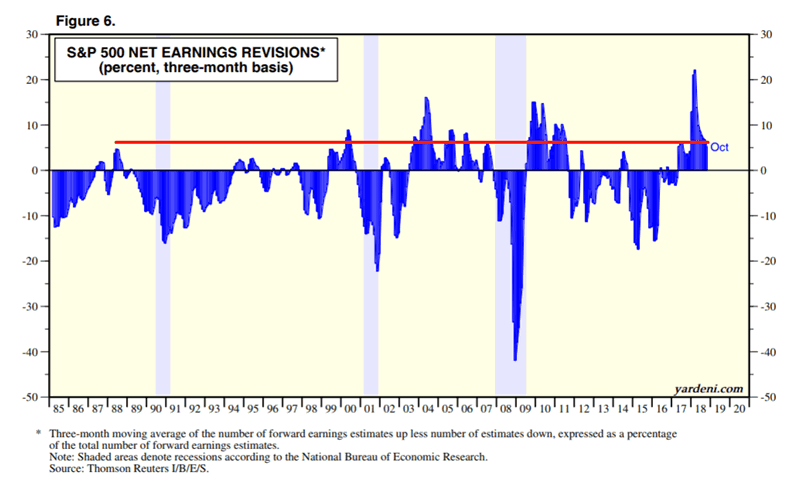
Source: Yardeni
And lastly, the Philadelphia Fed’s Leading Index is trending downwards. Historically, this means that we are close to the end of the economic expansion & bull market. In the past, this Leading Index reached 1% or lower before a bear market began. We’re not quite there yet, but getting there.
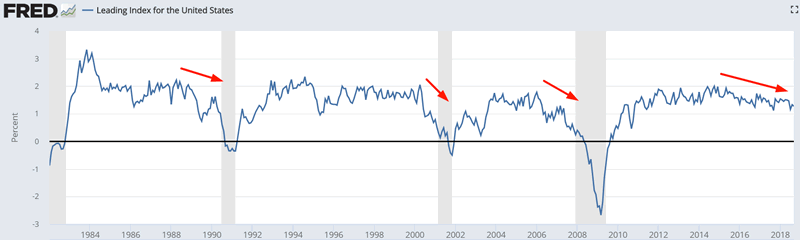
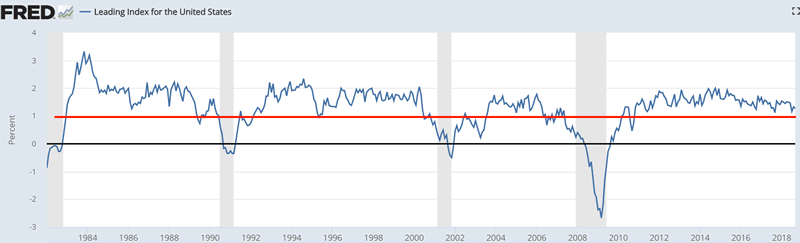
Source: FRED
Medium Term
Our medium term outlook (next 6-9 months) remains bullish.
*For reference, here’s the random probability of the U.S. stock market going up on any given day, week, or month.

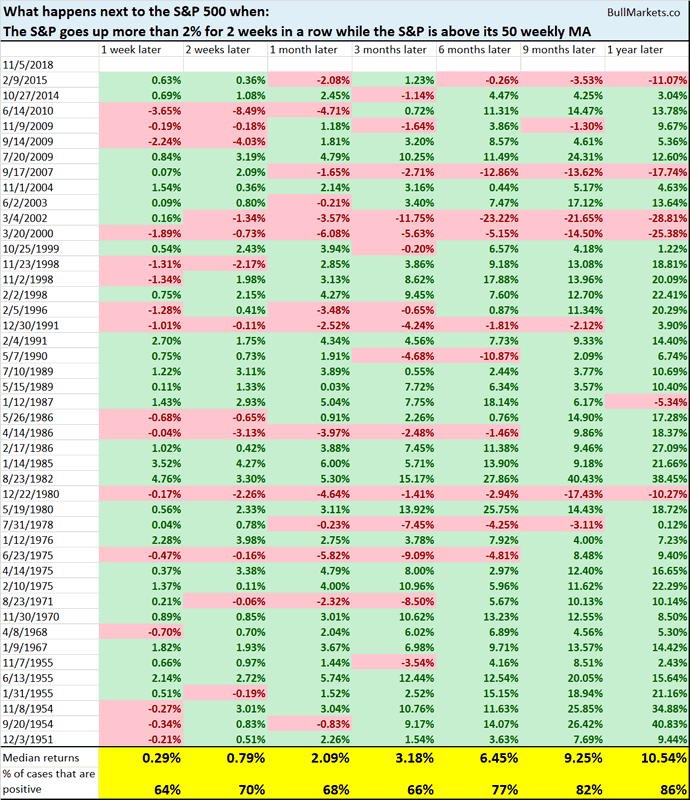
The S&P 500 went up more than 2% for 2 weeks in a row.
Source: Investing.com
When this happens (historically), the stock market’s 6-9 month forward returns are better than average.
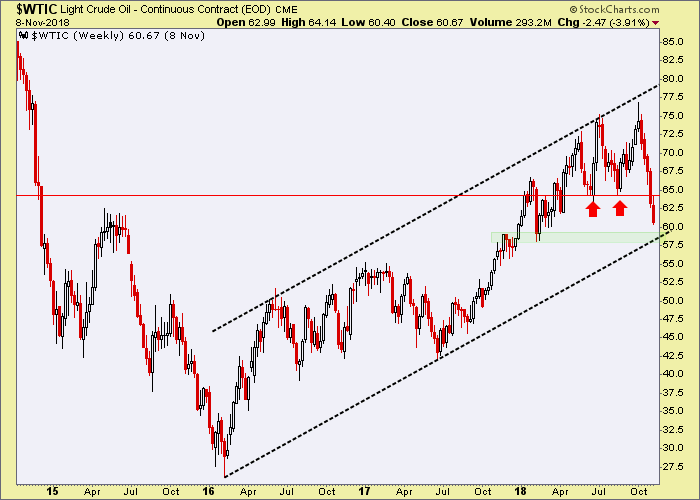
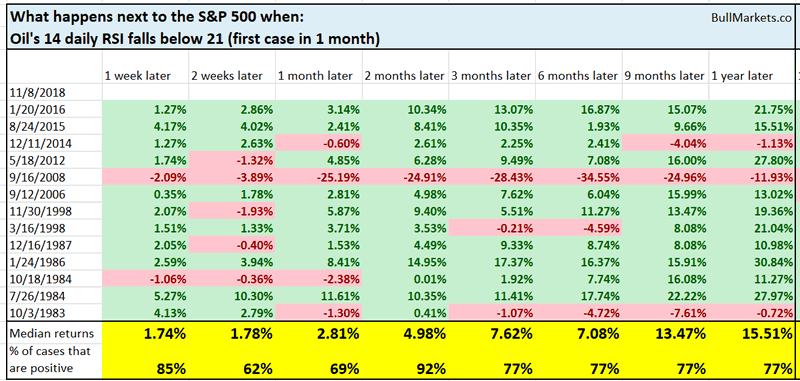
Meanwhile, oil has crashed. Oil’s 14 day RSI is now below 21.
When this happens (historically), oil tends go lower over the next 9 months, but the stock market’s forward returns are decent, especially 2 months later. Oil’s decline is unlikely to turn into “contagion” for the U.S. stock market.
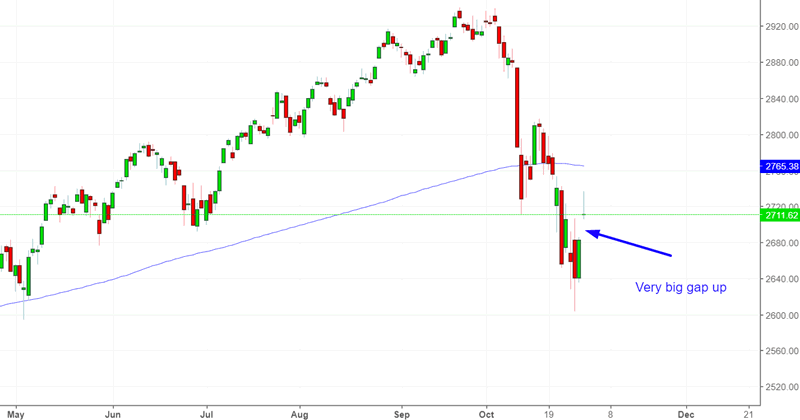
On Wednesday the U.S. stock market made a big “gap up”.
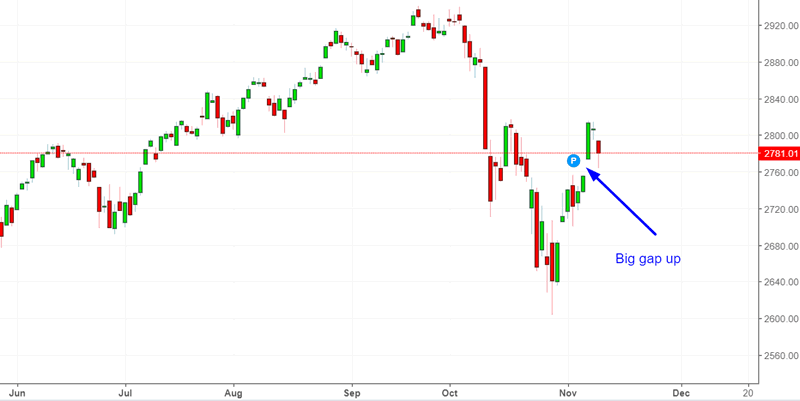
Source: Investing.com
Such big “gap ups” are usually a medium term bullish sign because it indicates ample “buy the dip” mentality in the market.
Here’s what happens next to the S&P when the daily LOW is more than 0.5% above the previous day’s HIGH.
As you can see, the stock market’s 6-9 month forward returns are decent.
As of Wednesday, breadth rebounded quickly, along with the stock market.
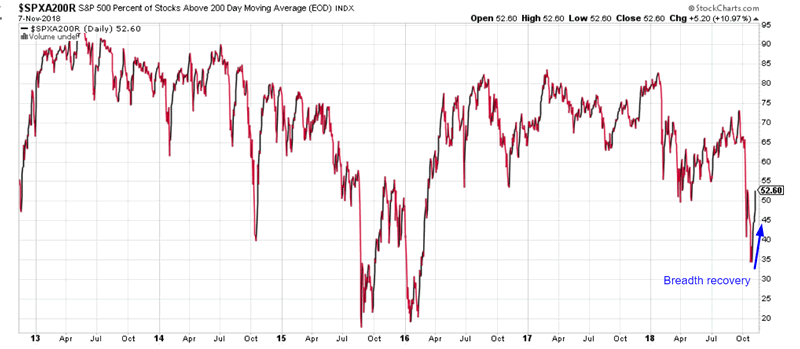
Source: StockCharts
Here’s what happened next to the S&P 500 when the % of stocks above their 200 dma went from below 35% to above 50% in less than 2 weeks.
*Data from 2004 – present
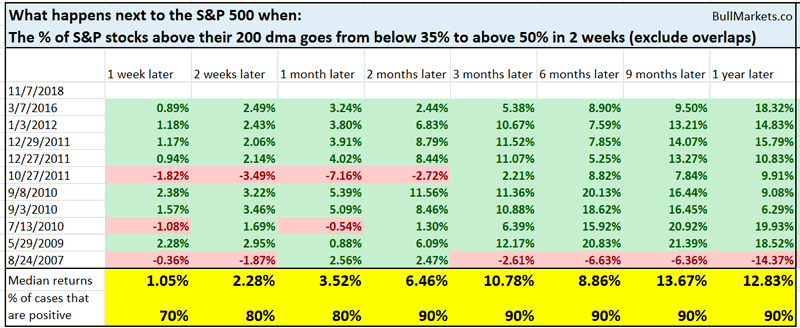
Once again, the stock market’s 6-9 month forward returns are decent.
On Tuesday, the S&P 500’s 1 month moving average (21 days) crossed below its 1 year moving average (252 days).
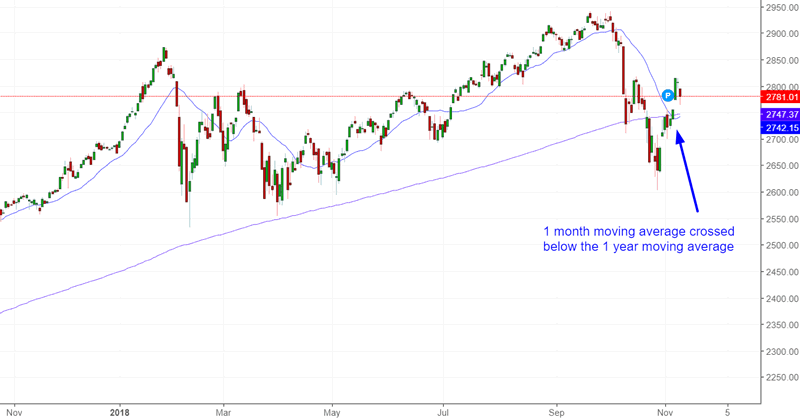
Source: Investing.com
This is the first “breakdown” since early-2016.
Here’s what happens next to the S&P when the 1 month moving average falls below tis 1 year moving average for the first time in 2 years.
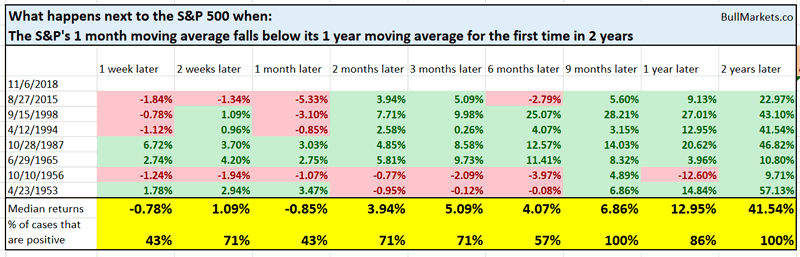
As you can see, the stock market tends to be choppy over the next 1 month, but the 9 month forward returns are decent.
Short-medium term
The stock market’s 1-2 month forward returns are mixed right now, because there is a >50% probability that the stock market will pullback before heading higher. Most of the “bearish cases” occur within the next 1 month.
NYMOT has rebounded rapidly. (NYMOT is the traditional NYSE McClellan Oscillator – a breadth indicator). As of Wednesday, NYMOT went from under -250 to above +200 in less than 1 month.
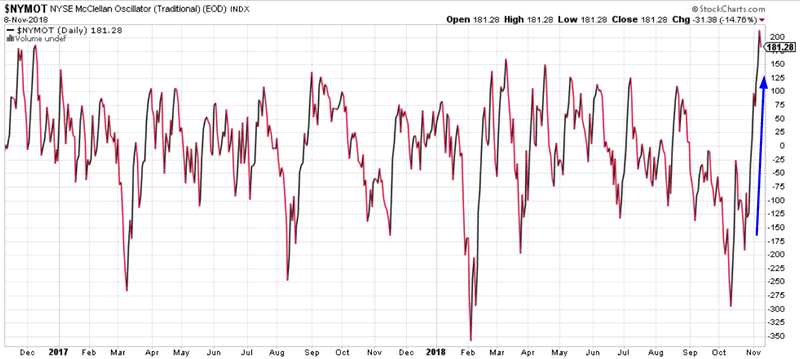
Source: StockCharts
Here’s what happened next to the S&P 500 when NYMOT went from under -250 to above +200 in less than 1 month.
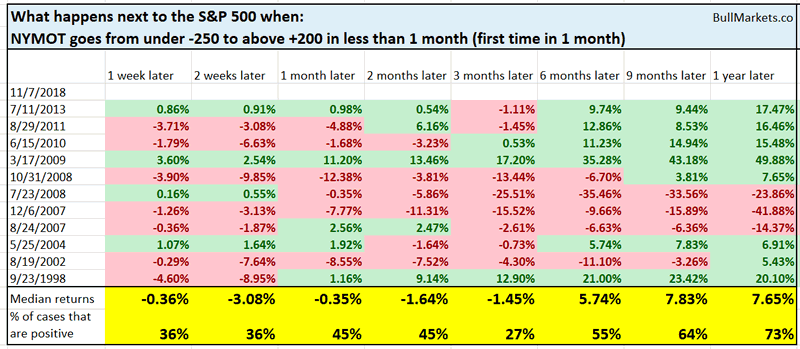
When this happens, the stock market’s forward returns over the next 2 weeks lean bearish.
Meanwhile, the Russell 2000 will soon make a “death cross”, whereby its 50 day moving average falls below its 200 day moving average.
Here’s what happens next to the Russell (historically) when it makes a “death cross”.
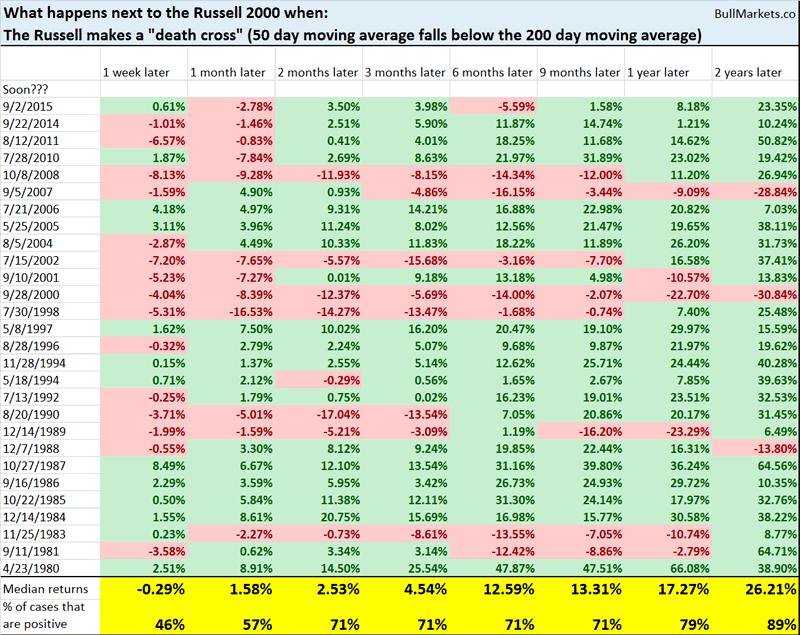
As you can see, small caps’ forward returns over the next 1 week lean bearish.
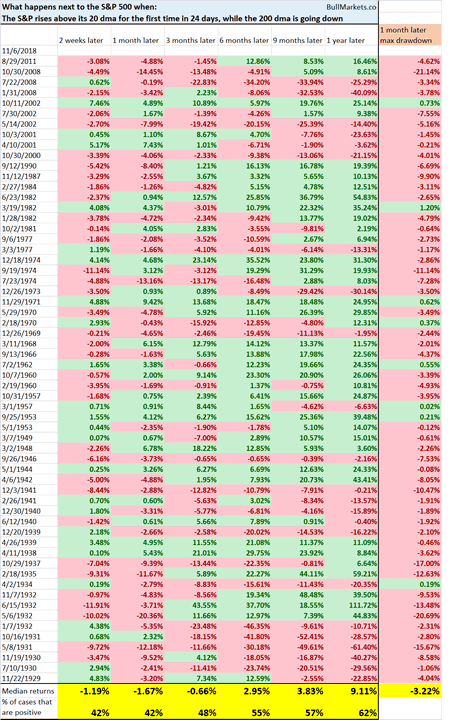
On Tuesday, the S&P 500 broke out above its 20 day moving average for the first time in 24 days, while the 200 day moving average was trending down.
When this happens, the stock market’s 1 month forward returns are slightly bearish.
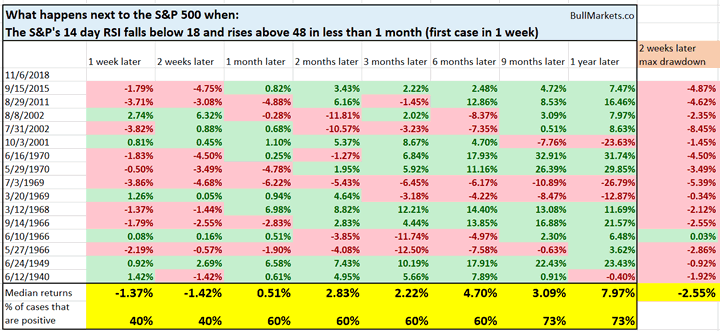
Along with breadth, the stock market’s momentum has rebounded rapidly. As of Tuesday, the S&P’s 14 day RSI has gone from under 18 to above 48 in less than 1 month.
Historically, this resulted in more volatility and short term losses over the next 2 weeks.
Click here to read last week’s discretionary market outlook.
Conclusion
Here is our discretionary market outlook:
- The stock market’s long term is bullish. The bull market will probably peak in mid-2019, after which a bear market will ensue.
- The stock market’s medium term is bullish (i.e. trend for the next 6-9 months).
- The stock market’s short term leans bearish over the next few weeks.
Focus on the medium term and the long term.
Our discretionary outlook is usually, but not always, a reflection of how we’re trading the markets right now. We trade based on our clear, quantitative trading models, such as the Medium-Long Term Model.
Members can see exactly how we’re trading the U.S. stock market right now based on our trading models.
Click here for more market studies
By Troy Bombardia
I’m Troy Bombardia, the author behind BullMarkets.co. I used to run a hedge fund, but closed it due to a major health scare. I am now enjoying life and simply investing/trading my own account. I focus on long term performance and ignore short term performance.
Copyright 2018 © Troy Bombardia - All Rights Reserved
Disclaimer: The above is a matter of opinion provided for general information purposes only and is not intended as investment advice. Information and analysis above are derived from sources and utilising methods believed to be reliable, but we cannot accept responsibility for any losses you may incur as a result of this analysis. Individuals should consult with their personal financial advisors.
© 2005-2022 http://www.MarketOracle.co.uk - The Market Oracle is a FREE Daily Financial Markets Analysis & Forecasting online publication.