


Stock Market Buy the Dip is Dead
Stock-Markets / Stock Markets 2018 Nov 20, 2018 - 05:30 PM GMTBy: Troy_Bombardia

Here’s today’s big headline from Bloomberg, one that really caught my attention.

Let’s determine the stock market’s most probable direction by objectively quantifying technical analysis. For reference, here’s the random probability of the U.S. stock market going up on any given day, week, or month.

*Probability ≠ certainty.
Buy the dip is failing (or dead)
Let’s get back to the Bloomberg headline:
For the first time in more than a decade, buying the dip isn’t working in the stock market.
As a way of measuring it, Morgan Stanley looked at rolling five-day declines in the S&P 500 Index this year and found that on average, the sixth day also generated a loss: of -0.05 percent. While the drop is small, it’s a big departure from the past 16 years, when dips gave way to gains.
Since 1980, the years when the buy-the-dip mentality was missing all involved bear markets: 1982, 1990, 2000 and 2002. To Mike Wilson, Morgan Stanley’s chief U.S. equity strategist, it’s a sign the market is sussing out troubles ahead, be it economic growth or corporate earnings.
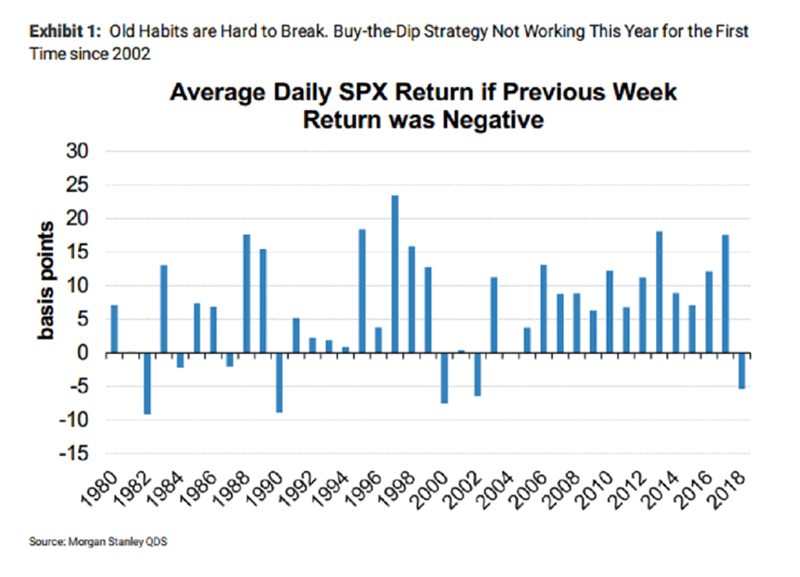
It seems like Morgan Stanley is limiting the data on purpose to create “evidence” to support their market outlook. Why not run the same study all the way back to 1950? It isn’t hard.
In my experience, whenever someone limits the data on purpose (e.g. “1980 – present”) instead of looking at the data holistically, they are trying to manipulate the data to confirm their own bias. It’s like saying “If I ignore the bullish cases and only look at the bearish cases, this study supports my bearish market outlook”.
Here’s the complete data set from 1950 – present.
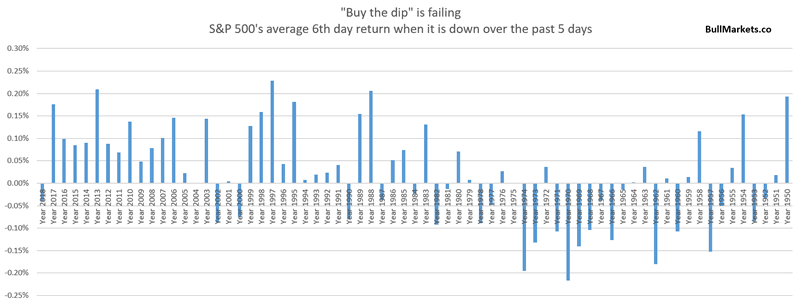
As you can see, this happens a lot more than you think, especially from the 1970s – 1960s.
I don’t see this as a long term bullish or bearish sign. It’s mostly irrelevant. This basically just looks at “if the S&P has been falling over the past 5 days, what’s the probability of a bounce vs. decline on the 6th day”. It’s a poor representation of “buy the dip” in the stock market.
Lots of volatility
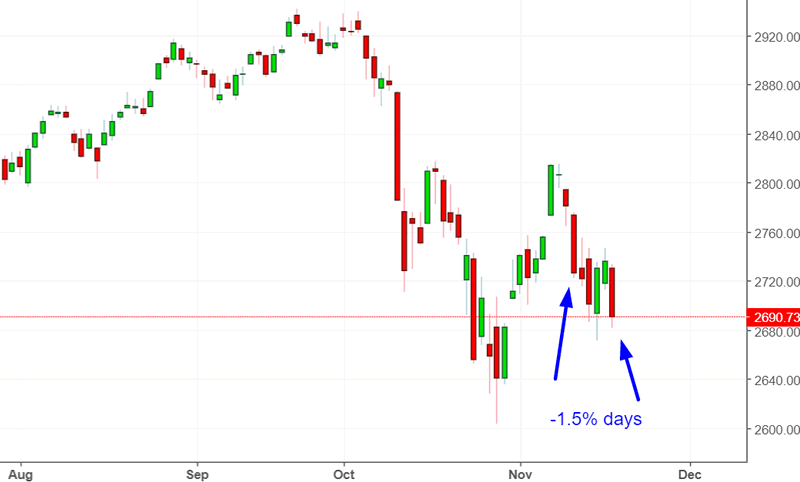
The U.S. stock market’s volatility remains high, with lots of big DOWN days.

Volatility is mean-reverting and tends to move in the opposite direction of the stock market.
6 of the past 29 trading days have seen the S&P 500 fall more than -1.5%.
Here’s what happened next to the S&P 500 when 6 of the past 30 days saw the S&P fall more than -1.5%, while the S&P was within 20% of a 3 year high.
*Data from 1928 – present
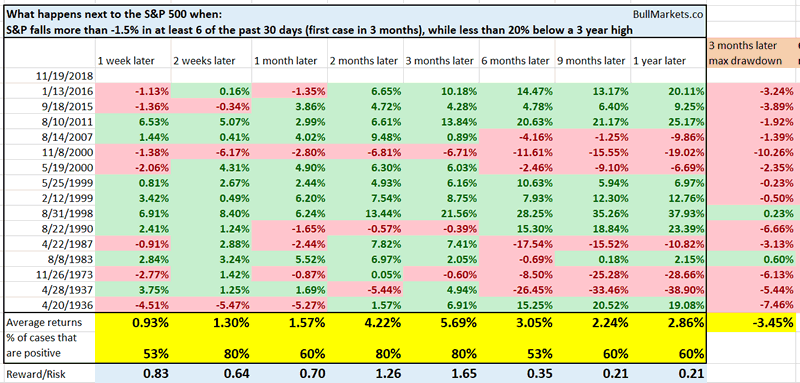
As you can see, the stock market tends to bounce over the next 2-3 months, after which forward returns deteriorate.
Back-to-back losses on Monday
The S&P 500 has seen back-to-back -1.5% Mondays.
Is this bad for the stock market? Is this a sign of “systematic selling”?
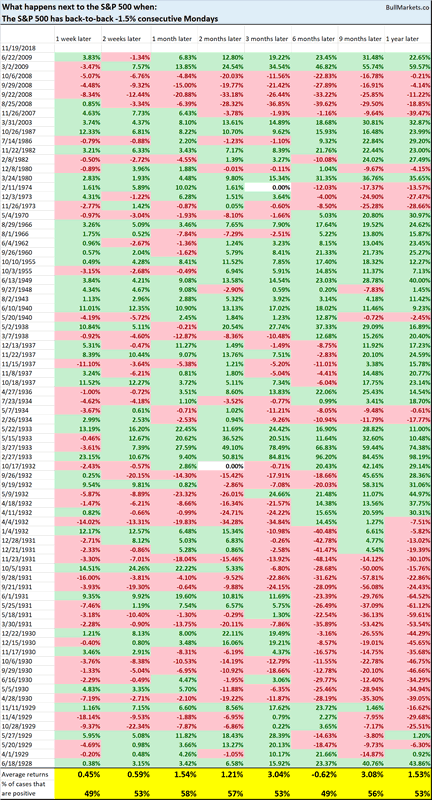
Here’s every single case of back-to-back -1.5% Mondays, from 1927 – present. As you can see, this is neither consistently bullish nor bearish for the stock market’s long term direction, although there is a bit of a bearish lean.
Click here to see yesterday’s market study
Conclusion
Our discretionary technical outlook remains the same:
- The current bull market will peak sometime in Q2 2019.
- The medium term remains bullish (i.e. approximately next half year).
- The short-medium term is mostly a 50-50 bet, although there is a slight bearish lean to it.
Focus on the medium term and long term. The short term is usually just noise.
Our discretionary outlook is usually, but not always, a reflection of how we’re trading the markets right now. We trade based on our clear, quantitative trading models, such as the Medium-Long Term Model.
Members can see exactly how we’re trading the U.S. stock market right now based on our trading models.
Click here for more market studies
By Troy Bombardia
I’m Troy Bombardia, the author behind BullMarkets.co. I used to run a hedge fund, but closed it due to a major health scare. I am now enjoying life and simply investing/trading my own account. I focus on long term performance and ignore short term performance.
Copyright 2018 © Troy Bombardia - All Rights Reserved
Disclaimer: The above is a matter of opinion provided for general information purposes only and is not intended as investment advice. Information and analysis above are derived from sources and utilising methods believed to be reliable, but we cannot accept responsibility for any losses you may incur as a result of this analysis. Individuals should consult with their personal financial advisors.
© 2005-2022 http://www.MarketOracle.co.uk - The Market Oracle is a FREE Daily Financial Markets Analysis & Forecasting online publication.