


Stock Market Retests October 2018 Bottom. What’s Next
Stock-Markets / Stock Markets 2018 Nov 22, 2018 - 12:14 PM GMTBy: Troy_Bombardia

 As per our recent market studies, we said that the stock market would probably bounce and then pullback. Sometimes that pullback leads to a marginal high (vs. the initial low), sometimes it leads to an exact retest, and sometimes it leads to a marginal low (vs. the initial low).
The stock market has made such a retest.
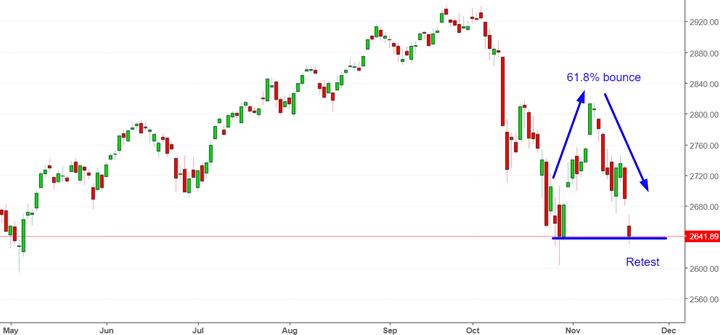
Retests typically “feel” worse than the initial lows because it “feels” like there is not enough buying support.
Let’s put aside said “feelings”.
Let’s determine the stock market’s most probable direction by objectively quantifying technical analysis. For reference, here’s the random probability of the U.S. stock market going up on any given day, week, or month.

*Probability ≠ certainty.
Heightened volatility
The stock market’s downside volatility remains heightened. The S&P 500 has experienced a lot of big DOWN days in the past 30 days.
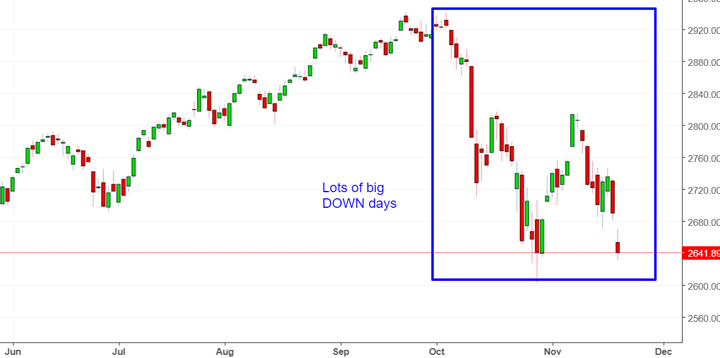
Here’s what happened next to the S&P 500 when at least 7 of the past 30 days saw the S&P fall more than -1.5%, while the S&P was within 20% of a 3 year high.
*Data from 1928 – present
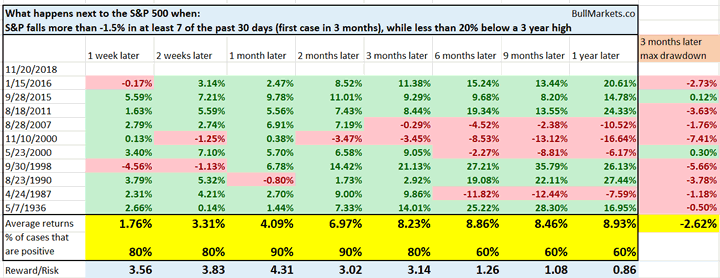
As you can see, the stock market tends to do well 1-3 months later, after which forward returns start to deteriorate.
Note that how even in the worst case scenario (November 2000), the S&P 500 did ok over the next month. Remember: even if this is the start of a bear market (which I think is unlikely), bear markets don’t go down in a straight line. There are plenty of bounces and rallies at first.
Consumer Discretionary vs Consumer Staples
XLY is the Consumer Discretionary ETF and XLP is the Consumer Staples ETF. This ratio tends to fall when the stock market falls because consumer discretionary (an aggressive sector) underperforms consumer staples (a defensive sector, like utilities).
This ratio has fallen quite a lot recently along with the stock market’s decline. As a result, the ratio’s weekly RSI is quite low.
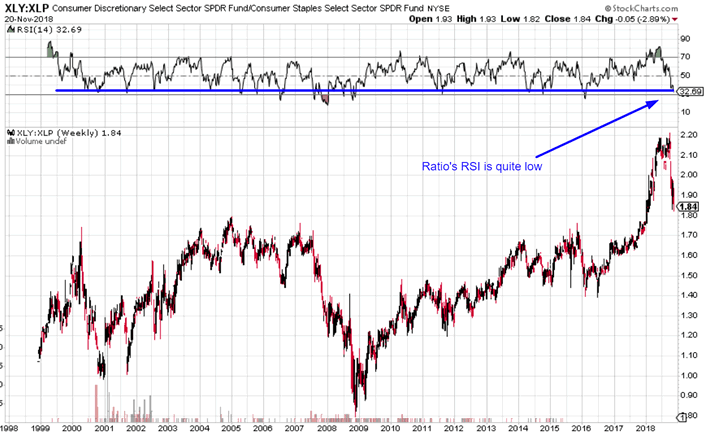
Here’s what happened next to the S&P 500 when the XLY:XLP ratio’s 14 weekly RSI fell below 33.
*Data from 1999 – present.
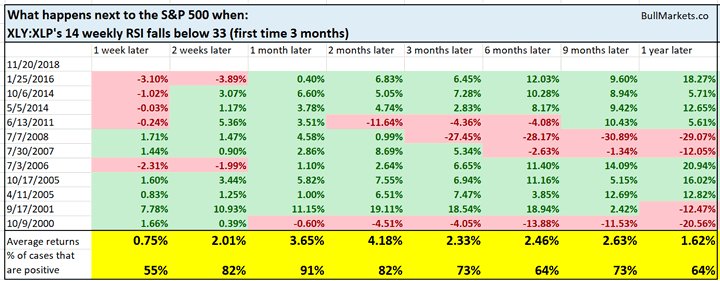
Once again, you can see that the S&P 500 tends to make a bounce 1-2 months later.
Netflix
Netflix has made a “death cross”, whereby its 50 day moving average fell below its 200 day moving average. CNBC thinks this is bearish for Netflix. Are they right?
Here’s what happens next to Netflix when it makes a death cross.
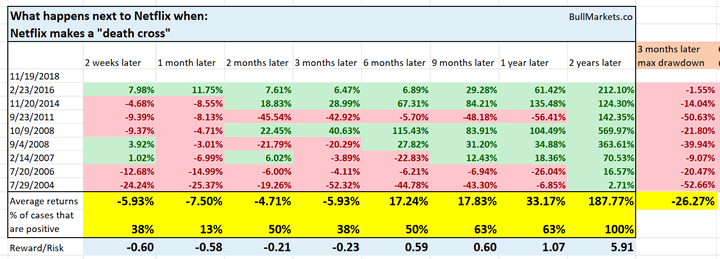
Interesting how Netflix almost always goes down 1 month later.
Irrelevant market studies
While the stock market has fallen, VIX refuses to make new highs.
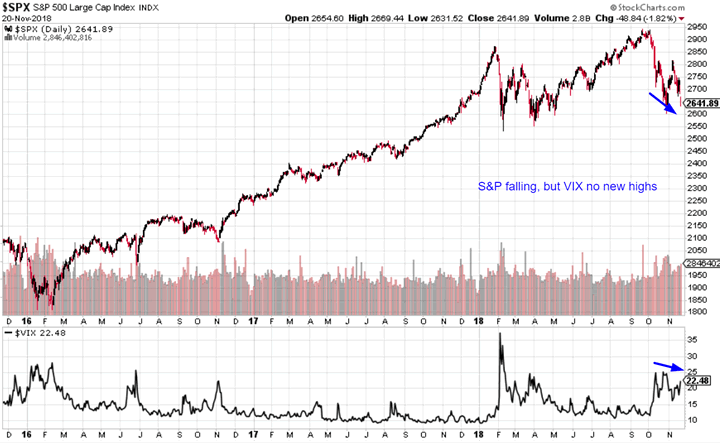
Many traders consider this to be a bullish sign for the stock market (i.e. bullish divergence). From what I’ve seen, this isn’t always the case.
The S&P 500 has fallen more than -1.5% for 2 consecutive days, while VIX has risen less than 15% on both of those days. In other words, VIX’s rise has been subdued.
Here’s what the S&P 500 does next when this happens.
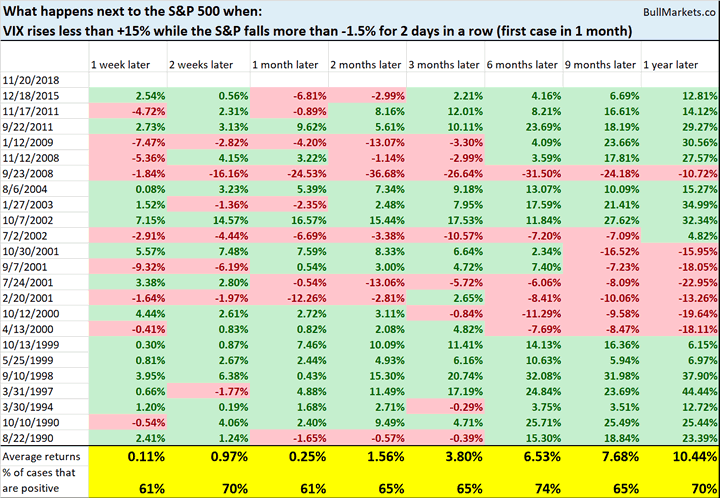
As you can see, the S&P 500’s forward returns are no different than random.
Gap down
The S&P 500 gapped down more than -1.3% on the OPEN today. This is quite rare.
Here are all the “gap downs” that were worse than -1.3% from 1962 – present
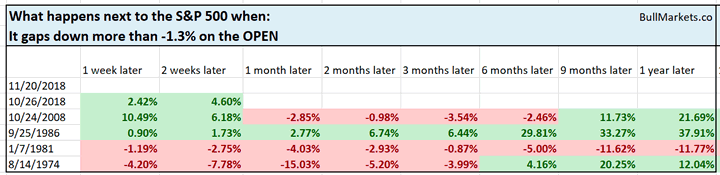
I wouldn’t put too much emphasis on this study. The sample size is small, but more importantly, gap ups and gap downs are more common than before because overnight trading has become more important. That’s globalization: more ex-U.S. players in the U.S. stock market today.
NASDAQ
The NASDAQ’s 14 weekly RSI has fallen below 35. Is this a sign that the NASDAQ will make an “oversold bounce”?
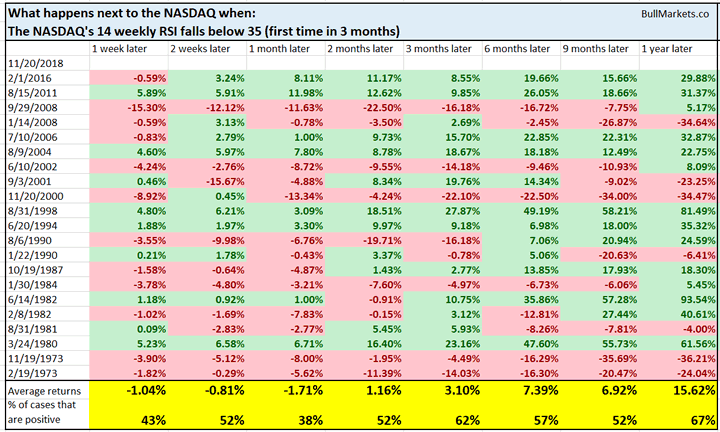
As you can see, the NASDAQ has a slight tendency to fall over the next 1 month.
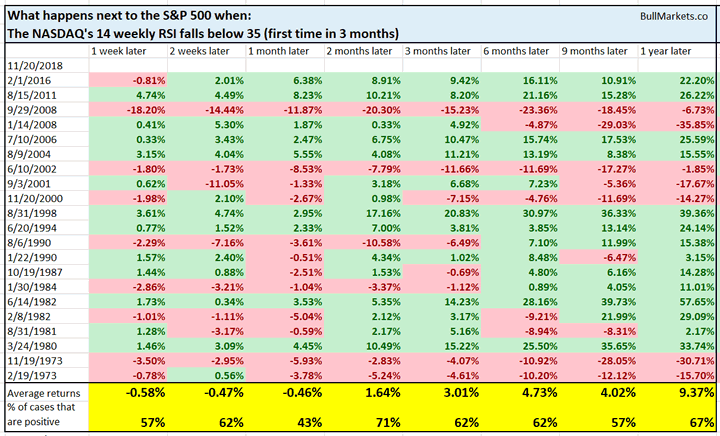
Meanwhile, this is neither consistently bullish nor bearish for the S&P 500.
Click here to see yesterday’s market study
Conclusion
Our discretionary technical outlook has changed a little
- The current bull market will peak sometime in Q2 2019.
- The medium term remains bullish (i.e. approximately next half year).
- The short-medium term is mostly a 50-50 bet. With that being said, it leans bullish.
We focus on the medium term and long term. We mostly ignore the short term, which is usually just noise.
Our market outlook is not always a reflection of how we’re trading the markets right now. We trade based on our clear, quantitative trading models, such as the Medium-Long Term Model.
Members can see exactly how we’re trading the U.S. stock market right now based on our trading models.
Click here for more market studies
By Troy Bombardia
I’m Troy Bombardia, the author behind BullMarkets.co. I used to run a hedge fund, but closed it due to a major health scare. I am now enjoying life and simply investing/trading my own account. I focus on long term performance and ignore short term performance.
Copyright 2018 © Troy Bombardia - All Rights Reserved
Disclaimer: The above is a matter of opinion provided for general information purposes only and is not intended as investment advice. Information and analysis above are derived from sources and utilising methods believed to be reliable, but we cannot accept responsibility for any losses you may incur as a result of this analysis. Individuals should consult with their personal financial advisors.
© 2005-2022 http://www.MarketOracle.co.uk - The Market Oracle is a FREE Daily Financial Markets Analysis & Forecasting online publication.