


The Fed Will Probably Stop Hiking Rates in 2019. What’s Next for Stocks
Stock-Markets / Stock Markets 2018 Nov 29, 2018 - 03:35 PM GMTBy: Troy_Bombardia

 Well that was quick. Less than 2 months ago Fed chairman Powell said that interest rates were “far below neutral” (implying that rates needed to be hiked much more). After the stock market has fallen 10%, Powell now thinks that “interest rates are close to being neutral” (implying that fewer rate hikes are needed).
The stock market rallied on this news.
Let’s determine the stock market’s most probable direction by objectively quantifying technical analysis. For reference, here’s the random probability of the U.S. stock market going up on any given day, week, or month.

*Probability ≠ certainty.
Will the Fed stop hiking interest rates in 2019?
If the Fed stops hiking rates in 2019, then that will be the setup for a medium term (multi-month) relief rally.
In the last 3 economic expansions, the final rate hikes were:
- June 29, 2006
- May 17, 2000
- May 17, 1989
Here’s what the S&P 500 did next in each of those cases
*Data from 1984 – present
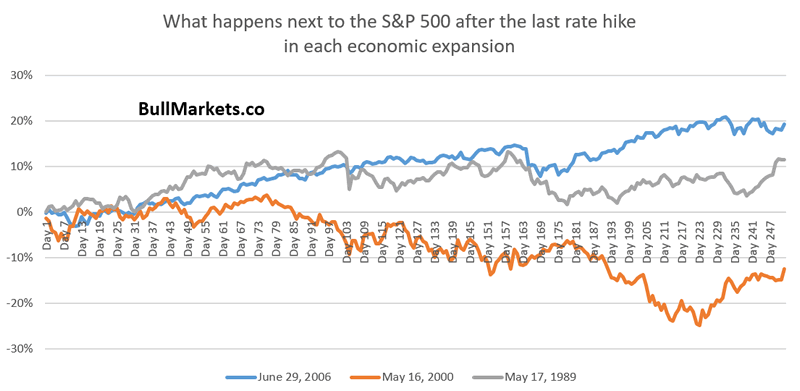
The stock market did ok over the next 4 months after the last rate hike in each economic expansion, after which trouble brewed.
Investors should watch out for the first rate cut after the last rate hike in each economic expansion.
- September 18, 2007
- January 3, 2001
- June 6, 1989
Here’s what the S&P 500 did next in each of those cases
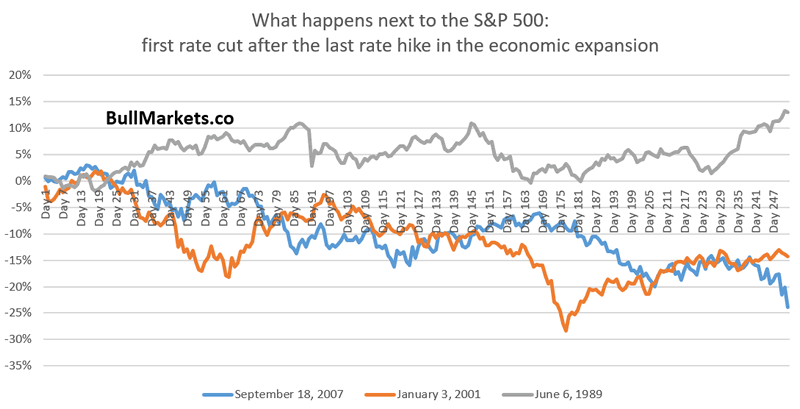
So why is it that the stock market tends to perform poorly (a recession is on its way) AFTER the Fed cuts rates? Because the Fed is reactive. It reacts to economic data. The Fed cuts rates because the economy is deteriorating. Significant economic deterioration = long term bearish for the stock market.
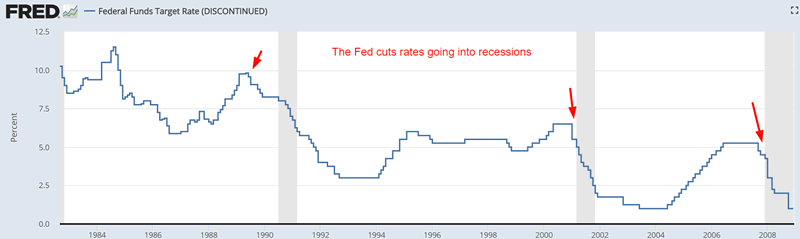
This will be a long term bearish sign if the Fed starts to cut rates in the second half of 2019.
Housing Sector: significant economic deterioration in 2019?
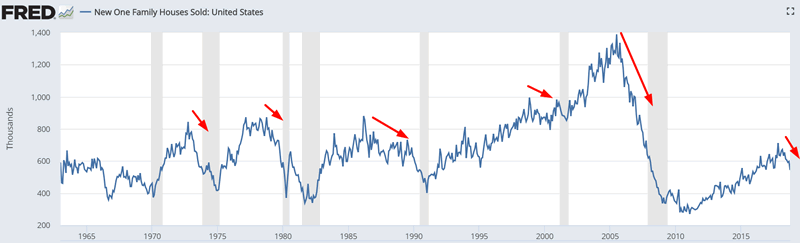
While everyone was focusing on Powell’s speech today, the real news came from New Home Sales.
New Home Sales continues to fall. The macro economy is deteriorating, which supports the case for a bull market top in 2019. Remember: tops are a process, not an event. That’s why tops tend to be flat with lots of volatility.
Here’s what happens next to the S&P 500 when New Home Sales is below its 12 month moving average for 5 consecutive months.
*Data from 1963 – present
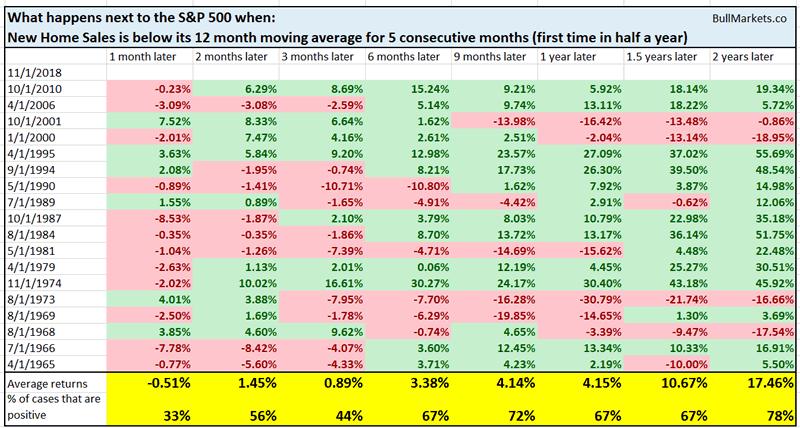
As you can see, this isn’t definitevely long term bearish for the stock market. But if New Home Sales continues to deteriorate, then that will be a long term bearish sign for stocks in 2019.
Margin debt
The latest FINRA margin debt figures came out today. Margin debt fell in October, along with the U.S. stock market (the 2 tend to move in the same direction).
Mark Hulbert wrote an interesting piece on Market Watch. Apparently some bearish advisors are basing their bearish outlook on the recent plunge in margin debt. “Margin debt falling below its 12 month moving average is bearish for stocks”.
That’s interesting, because these are the same advisors who get bearish when margin debt is rising. (If rising margin debt is bearish and falling margin debt is bearish, then when are these guys ever bullish?)
Here’s what happens next to the S&P 500 when margin debt falls below its 12 month moving average.
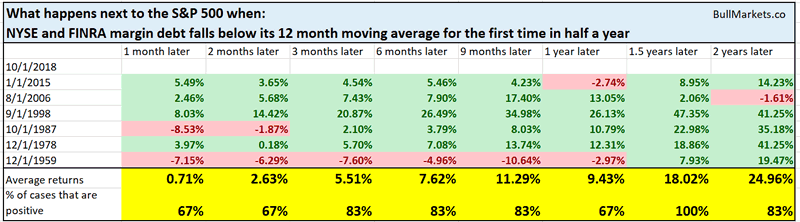
As you can see, falling margin debt isn’t necessarily bad for the stock market. Margin debt tends to move in the same direction as the stock market (i.e. coincident indicator).
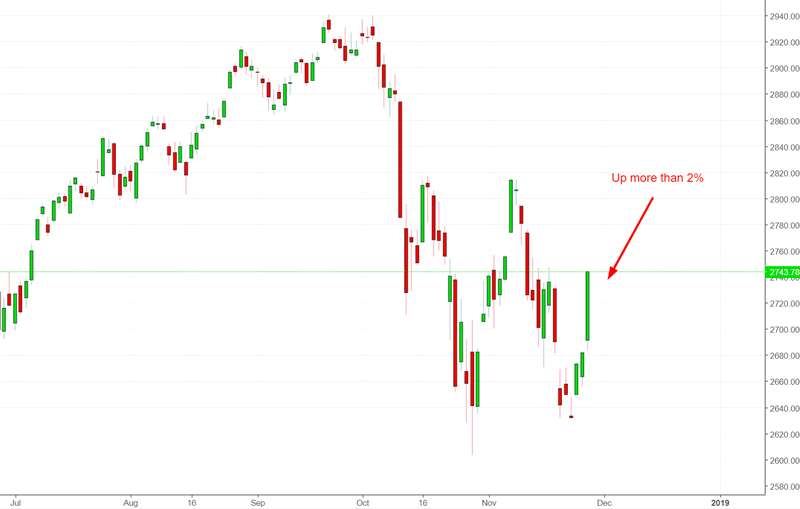
A lot of big “up days”
There have been 3 +2% days in the past 2 months. That is uncommon, especially with the S&P 500 less than -10% from a 2 year high. (Most big “up days” occur after the stock market has fallen a lot and daily volatility is extremely high).
Here’s what happened next to the S&P 500 when it had 3 or more +2% days in the past 2 months, while within 10% of a 2 year high
*Data from 1928 – present
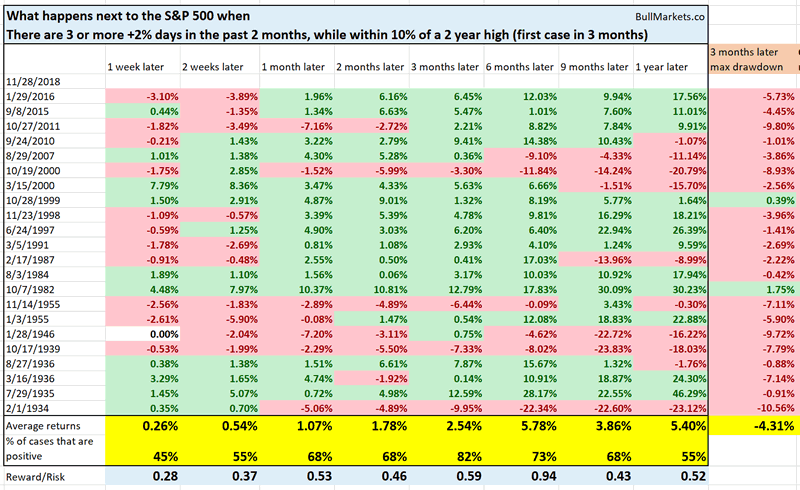
As you can see, the stock market tends to go up 3 months later, after which forward returns deteriorate.
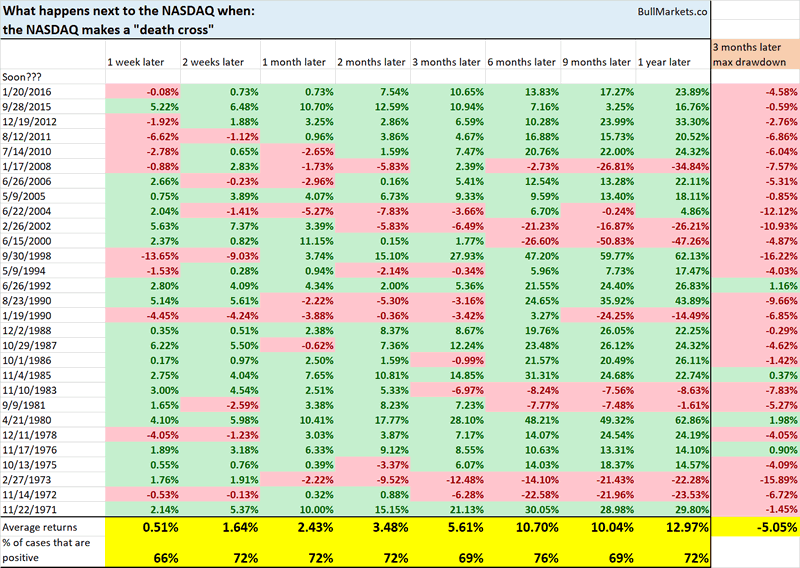
NASDAQ death cross
And lastly, the NASDAQ made a “death cross” today, whereby its 50 day moving average fell below its 200 day moving average.
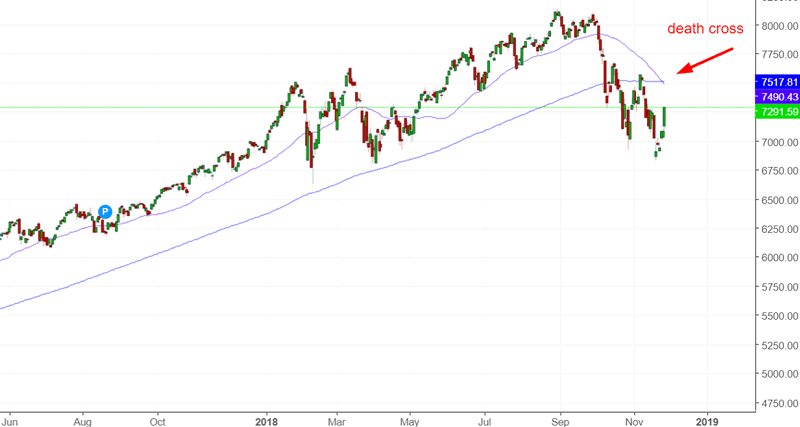
I wrote about this several days ago. As you can see, death crosses on their own are not bearish for the stock market.
Click here to see yesterday’s market study
Conclusion
Our discretionary technical outlook remains the same:
- The current bull market will peak sometime in Q2 2019.
- The medium term remains bullish (i.e. approximately next half year).
- The short-medium term is mostly a 50-50 bet.
We focus on the medium term and long term. We mostly ignore the short term, which is usually just noise.
Our discretionary market outlook is not a reflection of how we’re trading the markets right now. We trade based on our clear, quantitative trading models, such as the Medium-Long Term Model.
Members can see exactly how we’re trading the U.S. stock market right now based on our trading models.
Click here for more market studies
By Troy Bombardia
I’m Troy Bombardia, the author behind BullMarkets.co. I used to run a hedge fund, but closed it due to a major health scare. I am now enjoying life and simply investing/trading my own account. I focus on long term performance and ignore short term performance.
Copyright 2018 © Troy Bombardia - All Rights Reserved
Disclaimer: The above is a matter of opinion provided for general information purposes only and is not intended as investment advice. Information and analysis above are derived from sources and utilising methods believed to be reliable, but we cannot accept responsibility for any losses you may incur as a result of this analysis. Individuals should consult with their personal financial advisors.
© 2005-2022 http://www.MarketOracle.co.uk - The Market Oracle is a FREE Daily Financial Markets Analysis & Forecasting online publication.