


Stocks Bull Market Tops Are a Process
Stock-Markets / Stock Markets 2018 Dec 03, 2018 - 04:02 AM GMTBy: Troy_Bombardia

The U.S. stock market rallied last week and is now sitting just under its 200 day moving average.
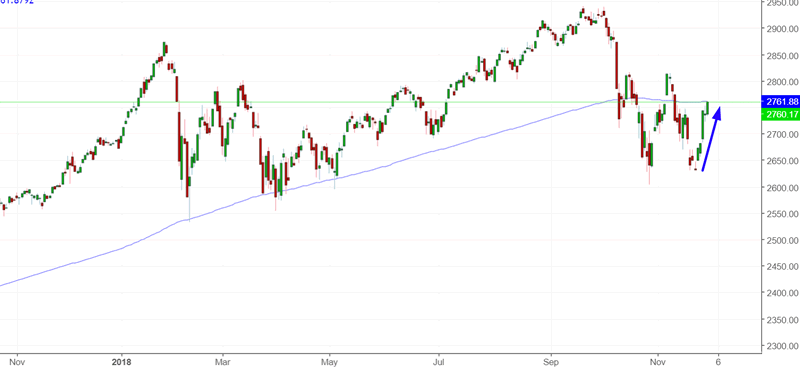
Source: Investing.com
The economy’s fundamentals determine the stock market’s medium-long term outlook. Technicals determine the stock market’s short-medium term outlook. Here’s why:
- The stock market’s long term is bullish, but this will change in 2019.
- The stock market’s medium term is bullish (i.e. next 6-9 months).
- The stock market’s short term is mostly a 50-50 bet.
*At this point in the late-cycle bull market, the medium term & long term have become one and the same.
We focus on the medium and long term. Let’s go from the long term, to the medium term, to the short term.
Long Term
Our long term outlook remains bullish. This bull market will probably last until Q2 2019, after which a bear market will ensue. (This date is a moving target and will be adjusted as new data becomes available).
The economy and the stock market move in the same direction in the long term. Hence, leading economic indicators are also long term leading stock market indicators.
Some leading indicators are showing signs of deterioration, but not enough for the bull market to peak. The usual chain of events looks like this:
- Housing – the earliest leading indicators – starts to deteriorate. Meanwhile, the U.S. stock market is still in a bull market while the rest of the U.S. economy improves. The rally gets choppy, with volatile corrections along the way. We are here right now
- The labor market starts to deteriorate. Meanwhile, the U.S. stock market is still in a bull market. This will likely happen in the first half of 2019.
- The labor market deteriorates some more, while other economic indicators start to deteriorate. The stock market tops, and the bull market is over.
Let’s look at the data.
For starters, the inflation-adjusted net value added to nonfinancial corporate business is trending sideways. This is a typical late-cycle sign for bull markets and economic expansions.
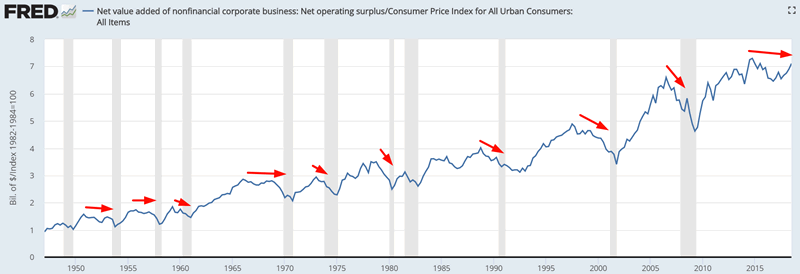
Source: FRED
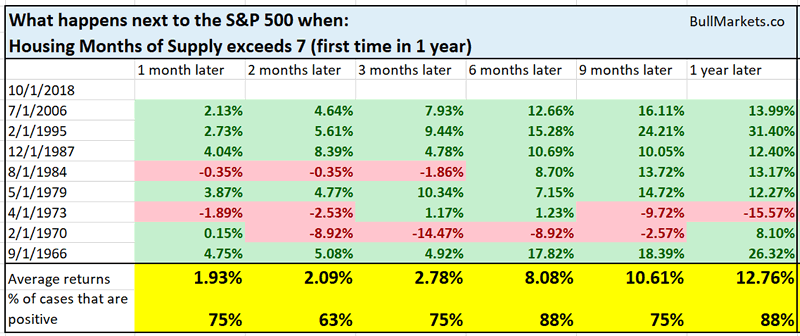
Housing Months of Supply is rising, which supports the other signs of weakness in the U.S. housing market. (Housing is a key leading sector for the overall economy.) This figure tends to trend upwards towards the end of bull markets and economic expansions.
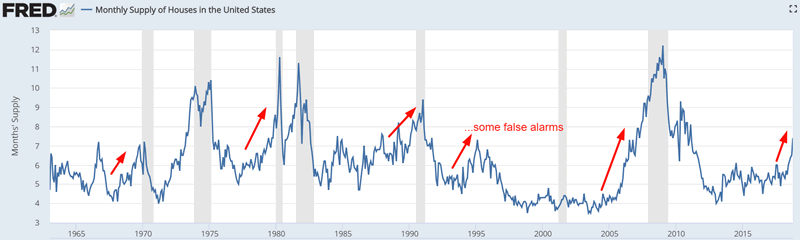
Source: FRED
This isn’t immediately bearish for the stock market, but it does serve as a warning sign.
Meanwhile, Initial Claims is trending sideways right now and Continued Claims will likely start to trend sideways over the next few months. This is not yet a long term bearish factor for the stock market & economy because Initial Claims has not trend upwards so far. But watch out over the next several months if Initial Claims starts to trend upwards.
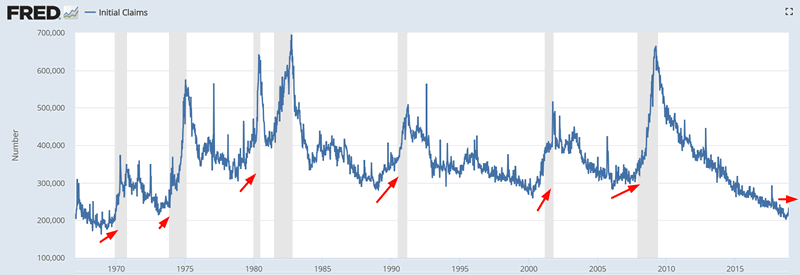
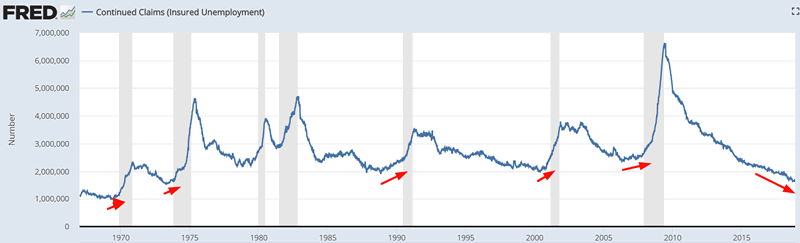
Source: FRED
Various parts of the yield curve will invert over the next 6-9 months, starting with the 5 year – 2 year yield curve and the 5 year – 3 year yield curve.
Here’s the 5 year – 2 year yield curve. It is currently at 0.06%, which means that it’ll invert very soon.
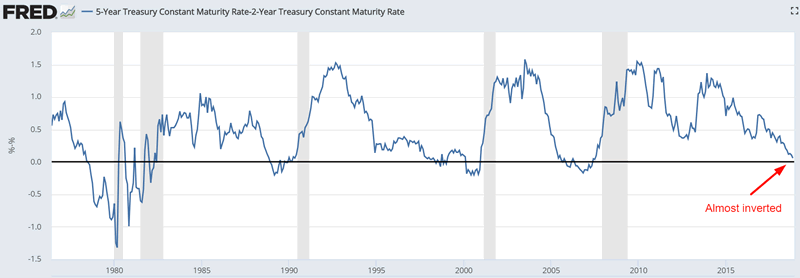
Source: FRED
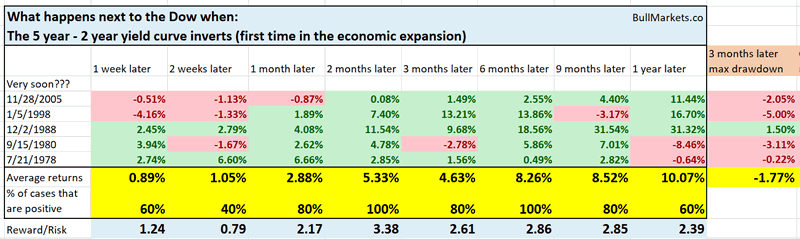
This isn’t immediately bearish for the stock market, as the stock market tends to go up over the next 6 months after the yield curve inverts.
But while this is definitely late-cycle for the bull market and economic expansion, many signs suggests that the top is not in.
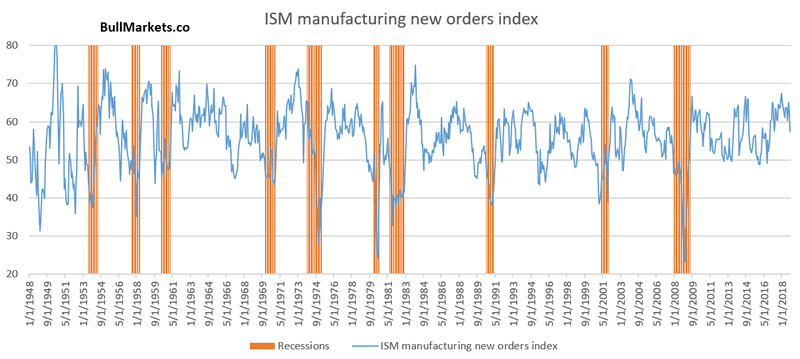
For example, the ISM manufacturing new orders index is currently at 57.4. In the past, bear markets and recessions started when the ISM manufacturing new orders index was at 50-55, or lower.
Meanwhile, inflation-adjusted New Orders is still trending higher. In the past, this figure trended lower before recessions and bear markets began.
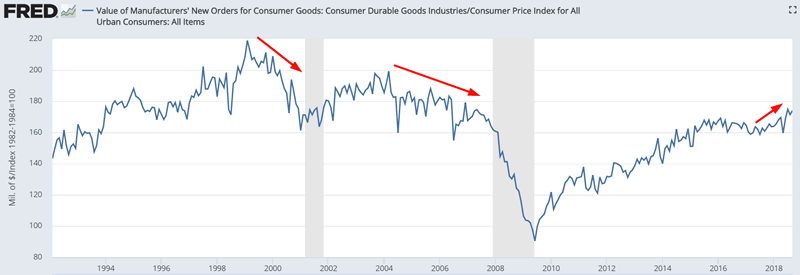
Source: FRED
The Delinquency Rate for All Loans is still trending downwards. In the past, this figure trended upwards before recessions and bera markets began.
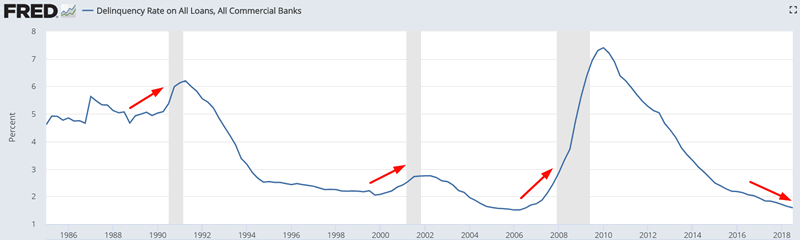
Source: FRED
And lastly, while investors are “afraid” of the Fed’s rate hikes, it’s the first rate cut that investors should be worried about. Historically, the stock market went up along with rate hikes because the economy improved. But by the time the Fed started cutting rates (because the economy deteriorated), that was a long term bearish sign for the stock market.
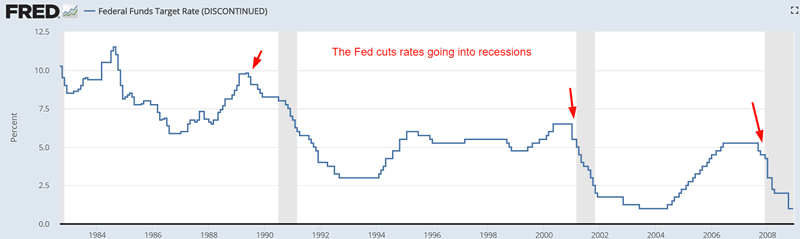
Source: FRED
Medium Term
Our medium term outlook (next 6-9 months) remains bullish.
*For reference, here’s the random probability of the U.S. stock market going up on any given day, week, or month.

For starters, the stock market made a strong upwards reversal this week.
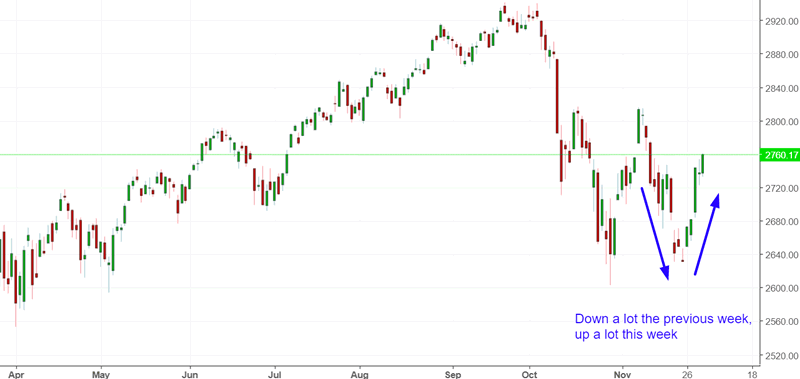
Source: Investing.com
Such strong reversals while the stock market is close to a multi-year high are uncommon, and are usually medium term bullish for the stock market.
Here’s what happened next when the S&P fell more than -3.5% the previous week and then rises more than +4.5% this week, while within 10% of a 2 year high.
*Data from 1928 – present
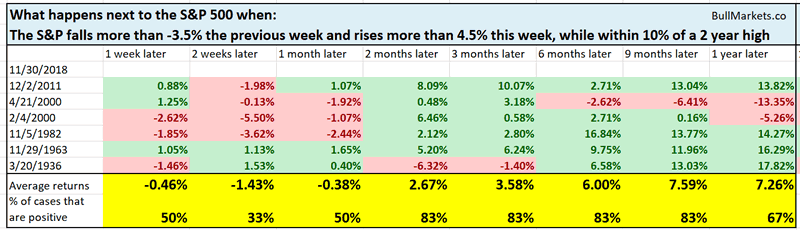
As you can see, the stock market might face short term weakness, but it does well over the next several months. Note the February 2000 and April 2000 cases. Even in the worst case scenario, the stock market did well over the next 2-3 months.
It’s worth noting that defensive sectors XLU (utilities) and XLP (consumer staples) significantly outperformed the S&P 500 over the past 2 months. This is not a long term bullish sign.
From 1998 – present, here are the cases when the S&P fell more than -5% over the past 2 months, while XLP and XLU rose more than +4%.
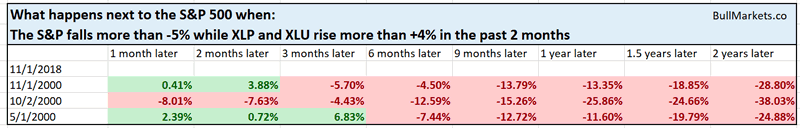
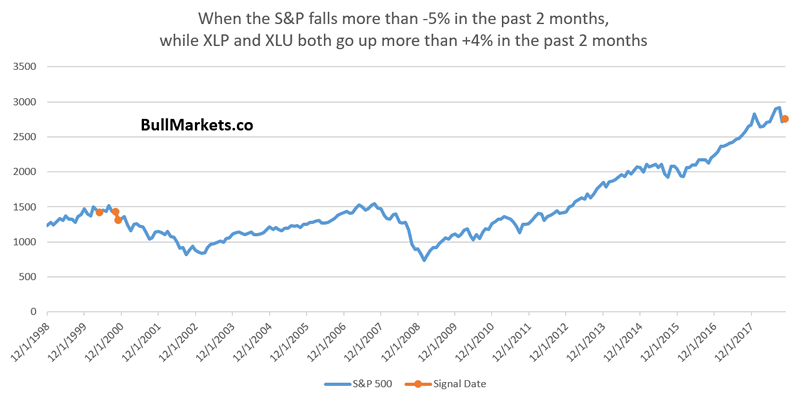
As you can see, the first case in the 1990s bull market was May 2000. The stock market did well over the next 3-4 months, after which it entered into a bear market.
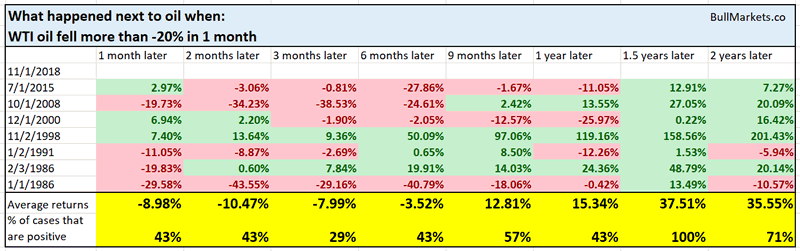
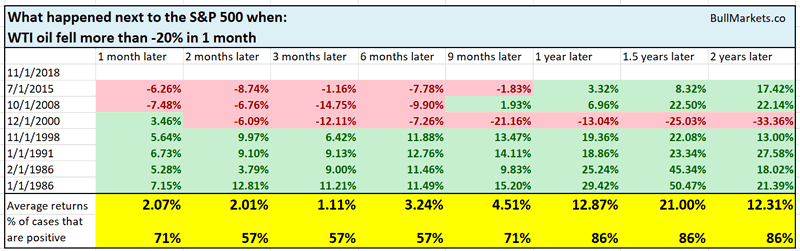
Oil’s crash over the past month is not a concern for U.S. stock market investors.
Here’s what happened next to oil and the S&P when oil fell more than -20% in 1 month
According to the Conference Board, a very high % of consumers are saying that jobs are “plentiful”. This mirrors the very low unemployment rate and tight labor market.
In other words, this is a sign of “as good as it gets” for the economy (and hence the stock market).
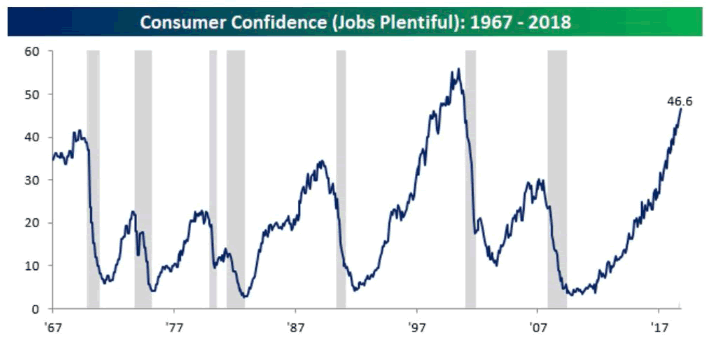
Source: Bespoke
Here’s what happened next to the S&P 500 when the % of consumers saying “jobs are plentiful” exceeds 46%.
*Data from 1967 – present
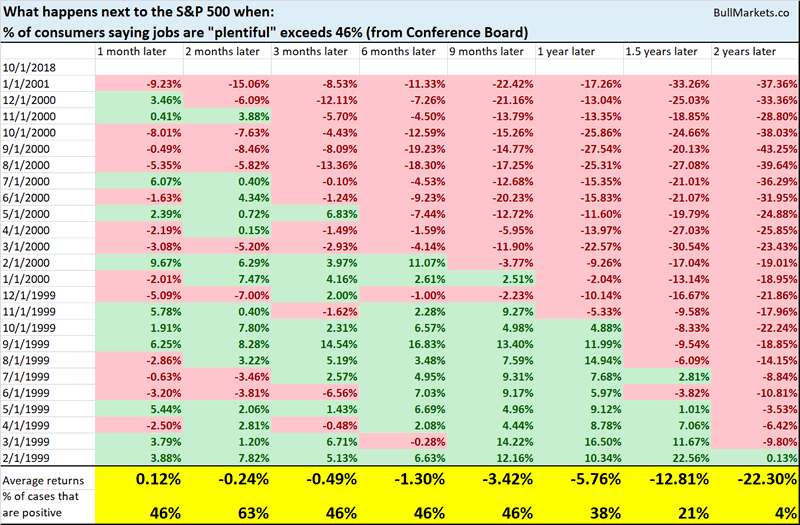
Notice how every single case is from February 1999 – January 2001. The first time this happened in the last cycle was February 1999, 1 year before the bull market topped. This suggests that the bull market has 1 year left, at most.
NAAIM measures the average exposure to U.S. stocks by active investment managers. This is a contrarian signal because most active investment managers (like most hedge funds) underperform buy and hold.
As of last week, NAAIM was very low, at 31%
Here’s what happened next to the S&P 500 (historically) when NAAim fell to 31%
*Data from 2006 – present
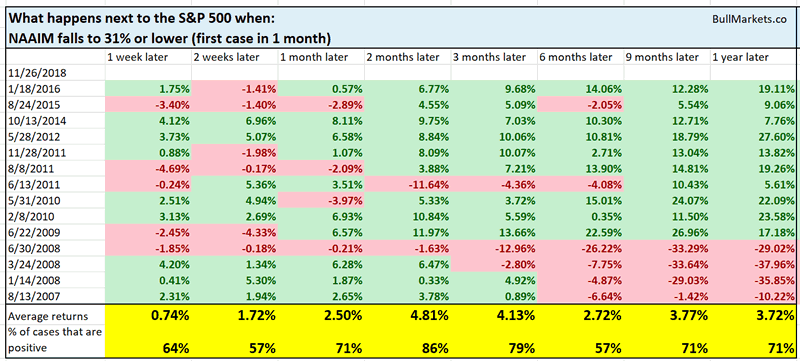
As you can see, the stock market tends to bounce 2 months later (and indeed it has been going up over the past week).
Short Term
The stock market’s short term is mostly a 50-50 bet right now, as it is most of the time.
Click here to read last week’s discretionary market outlook.
Conclusion
Here is our discretionary market outlook:
- The stock market’s long term is bullish. The bull market will probably peak in Q2 2019, after which a bear market will ensue.
- The stock market’s medium term is bullish (i.e. trend for the next 6-9 months).
- The stock market’s short term is mostly a 50-50 bet right now.
Focus on the medium term and the long term.
Tops are a process, marked by big up and down swings. Tops are not an event. Here are the 4 big bull market tops from 1950 – present.
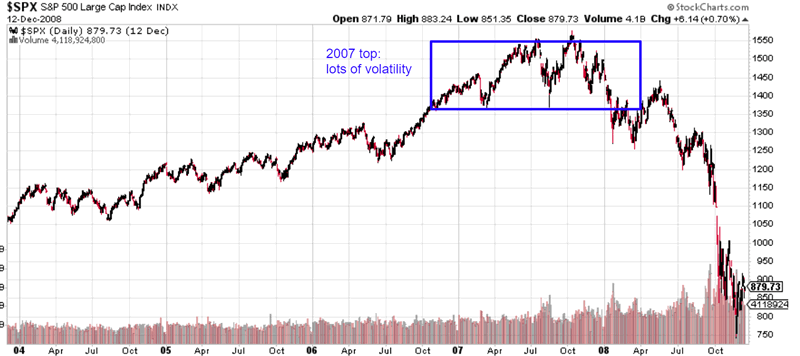
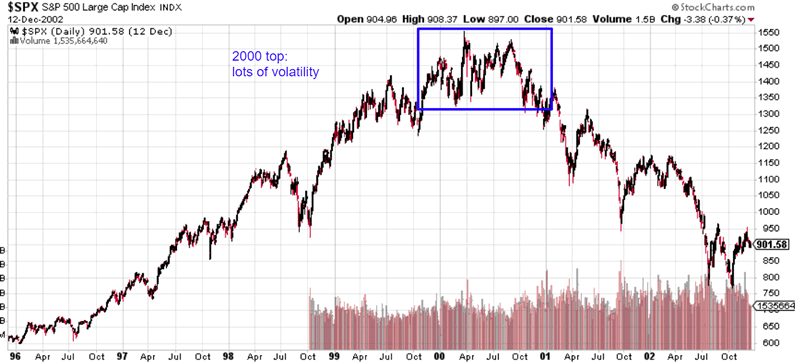
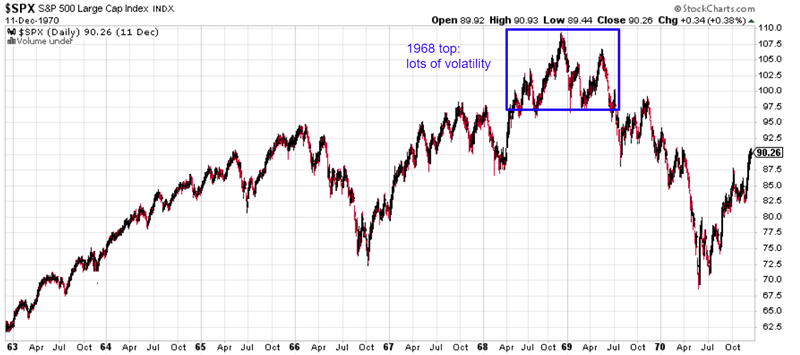
Source: StockCharts
Our discretionary outlook is not a reflection of how we’re trading the markets right now. We trade based on our clear, quantitative trading models, such as the Medium-Long Term Model.
Members can see exactly how we’re trading the U.S. stock market right now based on our trading models.
Click here for more market studies
By Troy Bombardia
I’m Troy Bombardia, the author behind BullMarkets.co. I used to run a hedge fund, but closed it due to a major health scare. I am now enjoying life and simply investing/trading my own account. I focus on long term performance and ignore short term performance.
Copyright 2018 © Troy Bombardia - All Rights Reserved
Disclaimer: The above is a matter of opinion provided for general information purposes only and is not intended as investment advice. Information and analysis above are derived from sources and utilising methods believed to be reliable, but we cannot accept responsibility for any losses you may incur as a result of this analysis. Individuals should consult with their personal financial advisors.
© 2005-2022 http://www.MarketOracle.co.uk - The Market Oracle is a FREE Daily Financial Markets Analysis & Forecasting online publication.