


US Stock Market Recovery Hinges On The Next Move
Stock-Markets / Stock Markets 2019 Jan 31, 2019 - 11:08 AM GMTBy: Chris_Vermeulen

 The research team, at The Technical Trades Ltd., has been calling this market move quite accurately. We made predictions on September 17, 2018, that called for a -5~8% downside market rotation, followed by price support just before the November 2018 US elections. After that, we called for a deep “Ultimate Low” price rotation to setup followed by a strong price rally. Even though we under-estimated the ultimate low-price rotation which was much deeper, our trend predictions from 120 days earlier are playing out quite accurately.
Currently, we are writing this message to all our followers to inform them that the Feb 1 Jobs report, as well as other critical earnings and economic data, are the “unknown factors” that have stalled this upside market move. At this time, it is our belief that capital has already started re-entering the US stock market and that a good portion of these investors are waiting for further evidence that a resurgence of price appreciation will continue without any new crisis events unfolding. Our September 17, 2018 analysis suggested that the US markets would find support after a “revaluation event” and continue an upward price bias. As this point, we believe we have reached the “momentum launchpad”.
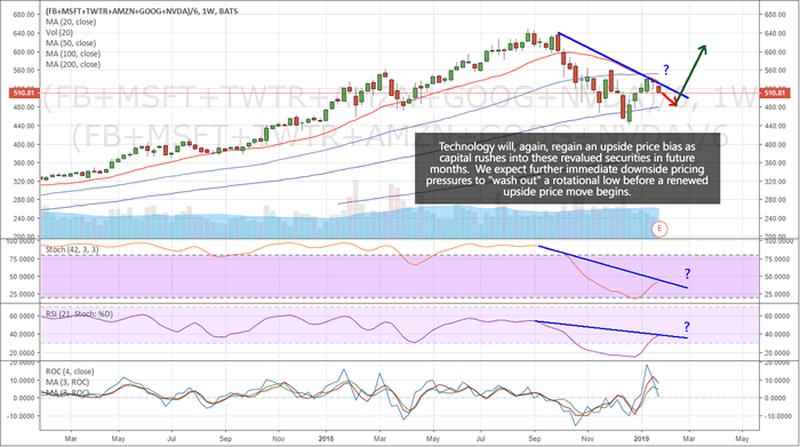
Custom Technology Index on a Weekly Chart
This first chart shows our Custom Technology Index on a Weekly basis. Our opinion is that Technology will likely continue to rotate a bit lower over the next few weeks, setting up a support level near or above December 2018 lows. This “setup” will likely prompt a new momentum base for Technology and the broader US equities markets to begin a renewed upside price rally. It makes sense that earning data, forward expectations, geopolitical news and renewed future guidance would prompt a price rotation near these current lows before capital comes rushing back into this sector attempting to ride the next wave higher.
I should note that we have been getting bearish signals on many of the leading tech stocks this week and when the majors sell off it pulls the indexes down as well. Tech stocks lead the bull market but are now underperforming and the smart money is now flowing into new sectors of the market with precious metals being the market leader. Its traders market now meaning you can’t just go buying big brand name stocks and make money, rather you need to be nimble and move to sectors and stocks that have investors money pouring into them.
Smart Capital Index Weekly Chart
Our Smart Capital Index, shown below on a Weekly basis, highlights the recent resurgence in buying in the US markets as well as highlights the current resistance near the RED line on this chart. This level represents a lower boundary that is acting like a temporary ceiling. A decent jobs number, continued strong earnings and economic data, as well as moderately strong future guidance, should see this level breached in early February or early March. In other words, even with reduced forward earnings guidance and income, the US equities markets are still the only game in town for global capital to avoid currency, economic and political risks that seem to be everywhere.
You can see from this Smart Capital Index that we’ve seen a massive revaluation event unfold from January 2018 to January 2019. Even though the US markets stayed relatively flat throughout this time, comparatively, our global Smart Capital Index showed the global markets were revaluing equity investments with a tremendous -26% price decline. That’s right, over the past 12 months, the global equities markets have declined by over 26% in a revaluation event that was initiated by global market concerns in China, Asia, Europe, and the Emerging Markets.
Our opinion is that a “reversion event” will likely take place over the next 12+ months where the strongest economies in the planet will recover to near or above the middle/upper levels on the Smart Capital Index chart. This would represent an 18~30% price recovery on this chart – or a 20~30% price recovery from December 2018 price lows for the US major indexes.
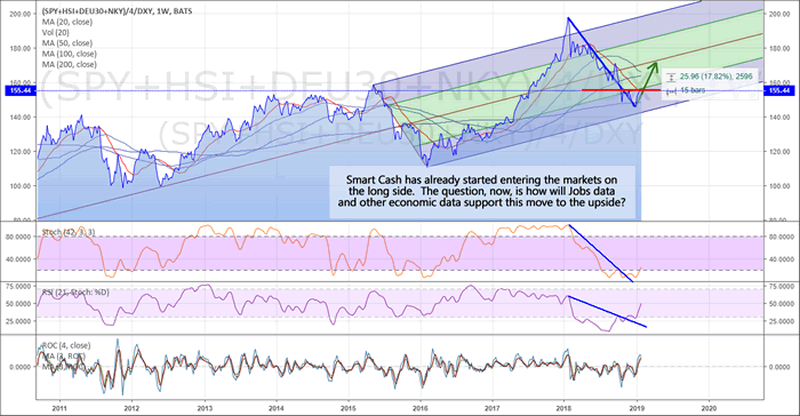
We have to remember that the US markets have become a leader in global markets and a safe-haven for global investors. Even though our Smart Capital Index has shown a massive price decline of -26%, the Dow Jones only decreased by -18% over that same time-span. Thus, if we are expecting a +18~30% price recovery on this chart, the Dow Jones may easily recover by 20~30% or more throughout this event.
The next 2~4 weeks will likely play out where Technology rotates lower and sets up a momentum base before starting to move higher. Our opinion is that the US Major Markets will likely base as well over this time. We believe a renewed buying interest will begin after February 16th as global investors continue to seek returns and safety for the remainder of 2019. We strongly believe the continued capital shift into the US markets will take place as soon as this momentum base sets up and price support is clearly evident to traders. This means we have about 2~4 weeks to plan for and set up strategic trades in preparation for this move to the upside.
Want to learn how we can help you find and execute incredible trading opportunities in 2019? Want to learn how our incredible proprietary price modeling systems can help you stay ahead of these market moves? Our researchers continue to call market moves 60, 90, 120+ days in advance. Visit www.TheTechnicalTraders.com to learn more about what we do and how we can help you create greater success.
Chris Vermeulen
www.TheTechnicalTraders.com
Chris Vermeulen has been involved in the markets since 1997 and is the founder of Technical Traders Ltd. He is an internationally recognized technical analyst, trader, and is the author of the book: 7 Steps to Win With Logic
Through years of research, trading and helping individual traders around the world. He learned that many traders have great trading ideas, but they lack one thing, they struggle to execute trades in a systematic way for consistent results. Chris helps educate traders with a three-hour video course that can change your trading results for the better.
His mission is to help his clients boost their trading performance while reducing market exposure and portfolio volatility.
He is a regular speaker on HoweStreet.com, and the FinancialSurvivorNetwork radio shows. Chris was also featured on the cover of AmalgaTrader Magazine, and contributes articles to several leading financial hubs like MarketOracle.co.uk
Disclaimer: Nothing in this report should be construed as a solicitation to buy or sell any securities mentioned. Technical Traders Ltd., its owners and the author of this report are not registered broker-dealers or financial advisors. Before investing in any securities, you should consult with your financial advisor and a registered broker-dealer. Never make an investment based solely on what you read in an online or printed report, including this report, especially if the investment involves a small, thinly-traded company that isn’t well known. Technical Traders Ltd. and the author of this report has been paid by Cardiff Energy Corp. In addition, the author owns shares of Cardiff Energy Corp. and would also benefit from volume and price appreciation of its stock. The information provided here within should not be construed as a financial analysis but rather as an advertisement. The author’s views and opinions regarding the companies featured in reports are his own views and are based on information that he has researched independently and has received, which the author assumes to be reliable. Technical Traders Ltd. and the author of this report do not guarantee the accuracy, completeness, or usefulness of any content of this report, nor its fitness for any particular purpose. Lastly, the author does not guarantee that any of the companies mentioned in the reports will perform as expected, and any comparisons made to other companies may not be valid or come into effect.
Chris Vermeulen Archive |
© 2005-2022 http://www.MarketOracle.co.uk - The Market Oracle is a FREE Daily Financial Markets Analysis & Forecasting online publication.