


A Stock Market Rally With No Pullbacks. What’s Next for Stocks
Stock-Markets / Stock Markets 2019 Feb 13, 2019 - 05:27 PM GMTBy: Troy_Bombardia

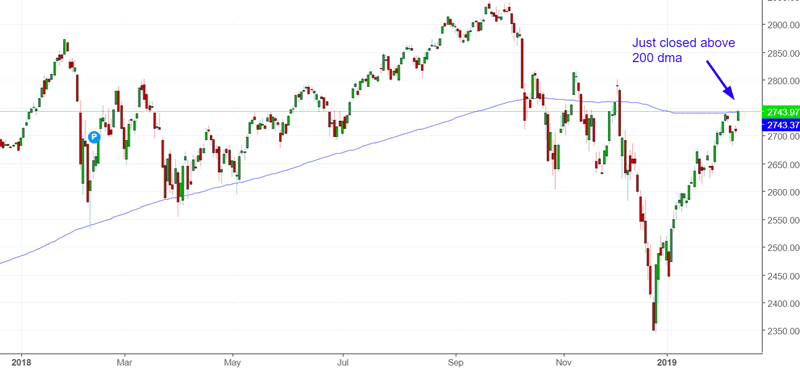
In a rally with no pullbacks, the S&P 500 has finally closed above its 200 day moving average (slightly).
Go here to understand our fundamentals-driven long term outlook.
Let’s determine the stock market’s most probable medium term direction by objectively quantifying technical analysis. For reference, here’s the random probability of the U.S. stock market going up on any given day.

*Probability ≠ certainty. Past performance ≠ future performance. But if you don’t use the past as a guide, you are blindly “guessing” the future.
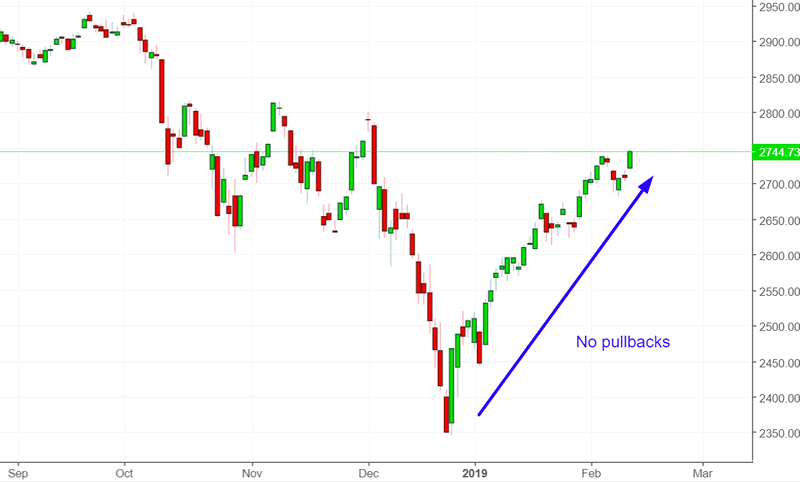
No pullbacks
There have been no meaningful pullbacks during the stock market’s rally, leaving many traders sitting on the sidelines.
The S&P has rallied more than 15% over the past 33 days, while experiencing only two -1% daily losses.
Similar no-pullback rallies happened in:
- August 2009
- November 1998 (after the -20% decline)
- June 1997
- February 1987
- December 1962
- July 1955
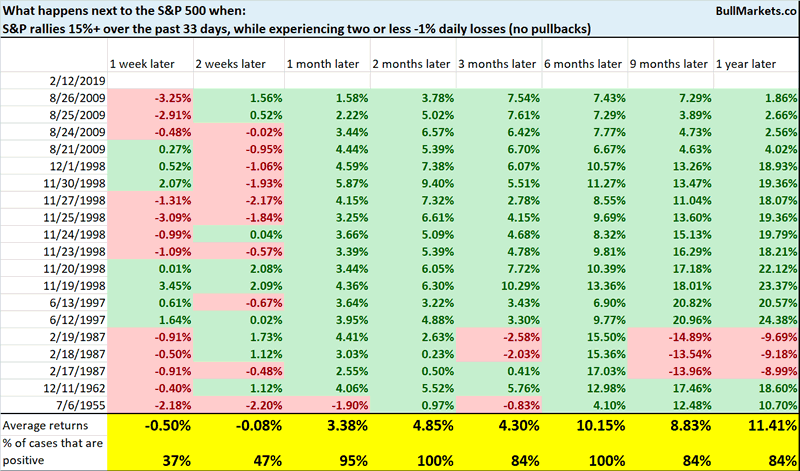
*Data from 1950 – present
The stock market’s 2 month and 6 month forward returns were quite bullish
Breakout
The S&P 500 closed above its 200 day moving average, albeit just barely. This breakout occurs after the S&P was deeply oversold in December 2018.
Here’s what happens enxt to the S&P when it closes above its 200 dma, after being more than -14% below its 200 dma sometime in the past 3 months.
*Data from 1950 – present
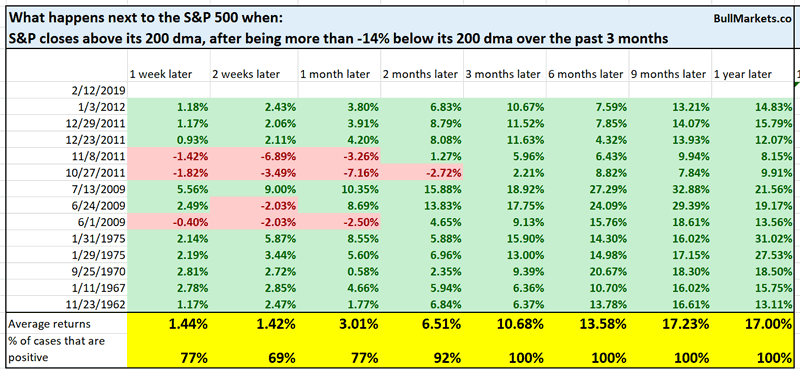
As you can see, the stock market’s 3-12 month foward returns are bullish
Baltic Dry Index
As the Baltic Dry Index continues to fall, some permabears are asking “how can the U.S. stock market be much higher today than where it was in 2016, if the Baltic Dry Index today is exactly where it was in 2016”?
*This question is non-sensical. It’s like asking “how can the stock market today be much higher than where it was in 1955, even though the Unemployment Rate today is the same as the Unemployment Rate in 1955”? The Baltic Dry Index swings in a wide range over the long term.
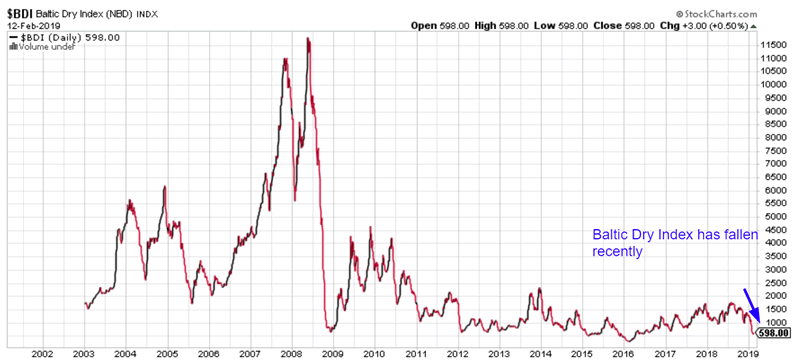
The Baltic Dry Index (a measure of global shipping) is now -56% below its 200 dma, signaling a slowdown in global trade.
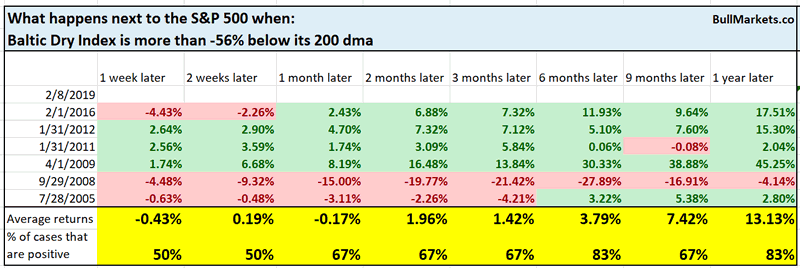
Historically, this is not consistently bullish or bearish for stocks. This indicator has too many false signals.
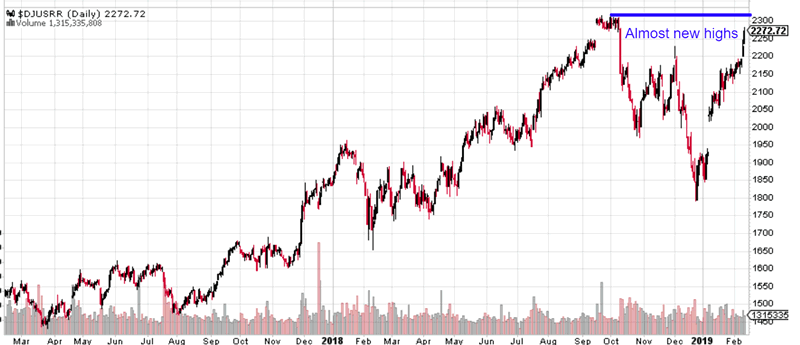
Railroads
While broad stock market indices are still a ways off from all-time highs, the Dow Jones Railroad Index is already near all-time highs. Is this a bullish sign for the stock market?
Here’s what happens next to the S&P when the Dow Jones Railroad Index is within -2% of a 1 year high, while the S&P is more than -6% below its 1 year high
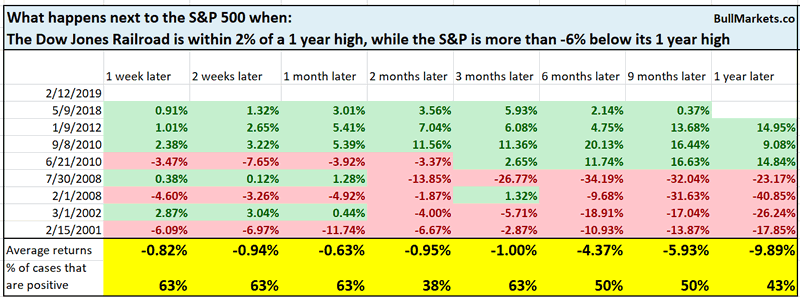
Not consistently bullish or bearish. Sometimes this happens in bear markets (see 2001-2002 and 2008). Sometimes this happens in bull markets.
Low volatility
The S&P Low Volatility ETF (SPLV) is overbought. Is this a short term bearish sign for the S&P 500 or SPLV?
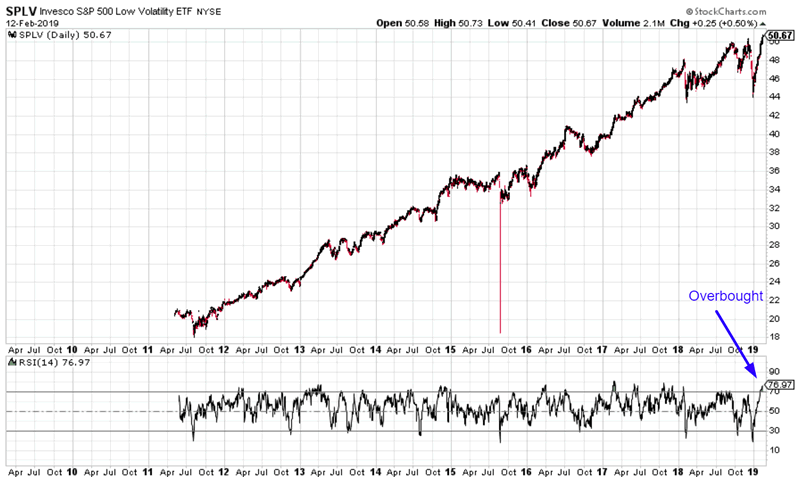
Here’s what happens next to SPLV when its 14 day RSI exceeds 76
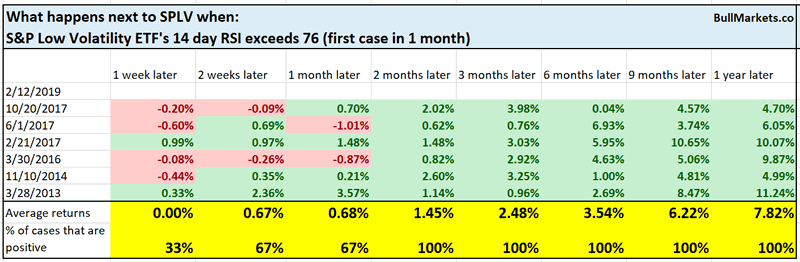
There is a slight tendency for SPLV to fall in the short term.
Here’s what happens next to the S&P
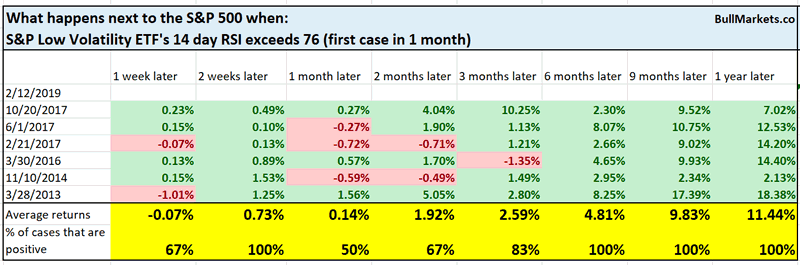
Do not take this as a long term bullish sign. The historical data for SPLV dates from 2011-present. Since there is no bear market data for SPLV, it’s only natural that all the 6-12 month forward returns are bullish.
Breadth
There are 2 ways to use breadth indicators:
- Breadth extremes
- Breadth divergences
I find breadth extremes to be more useful than breadth divergences. The problem with “divergences” isn’t that they don’t work. It’s that they work 50% of the time, i.e. not much better than a coin toss.
- Sometimes a divergence successfully predicts a reversal in the market
- Sometimes a divergence fails to predict a reversal in the market
Right now, our cumulative NYAD (a breadth indicator) is within -0.5% of a 2 year high, while the S&P is more than -6% below a 2 year high. In other words, breadth is going to make new all-time highs before the stock market does.
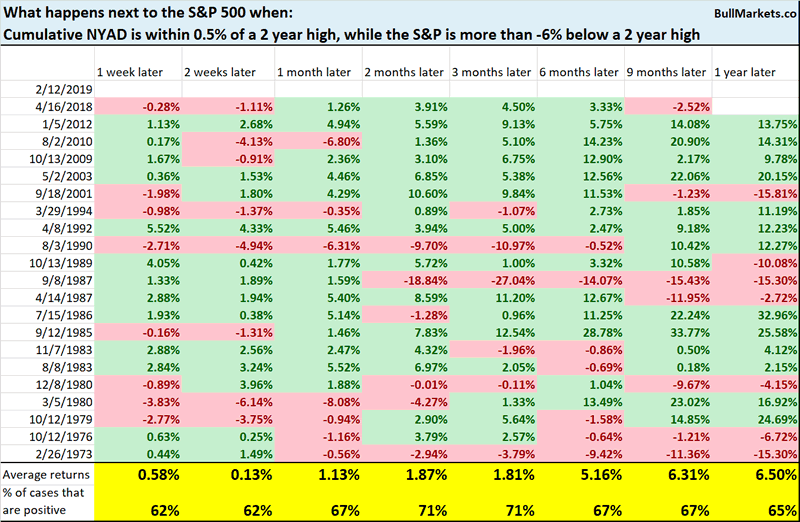
Historically, this is not consistently bullish or bearish for stocks
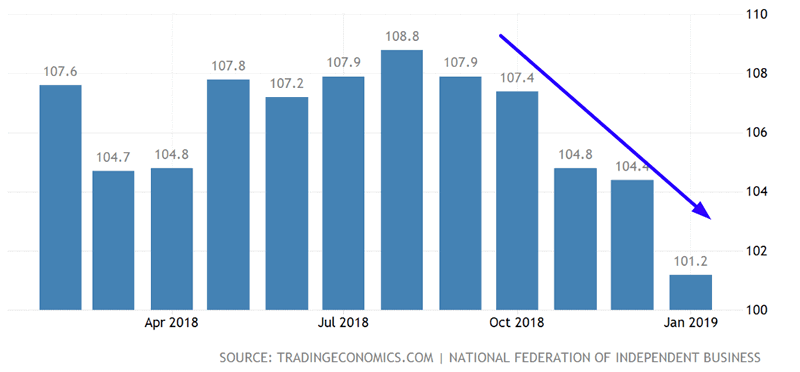
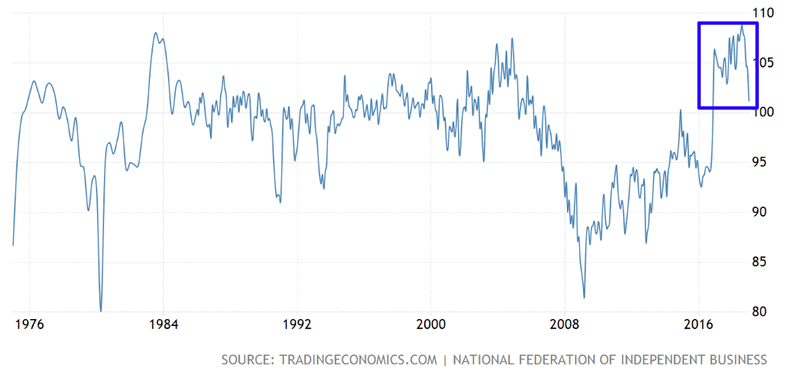
NFIB Small Business Optimism
NFIB Small Business Optimism has fallen 5 months in a row.
Here’s what happens next to the S&P 500 when NFIB Small Business Optimism falls 5 months in a row
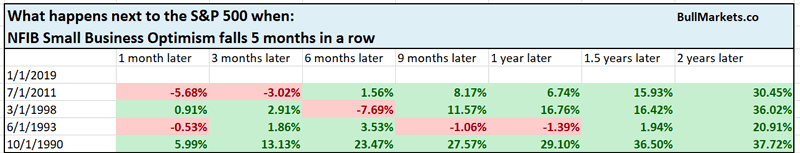
Surprisingly, the stock market’s long term forward returns are bullish instead of bearish. Why?
- Major bear markets (e.g. 2000-2002, 2007-2009) usually start as choppy declines. This is because most investors are in disbelief. Their constant “buying the dip” slows down the decline.
- -15 to -20% corrections are usually much more fierce. I.e. a nonstop selloff
The stock market’s nonstop selloff in Q4 2018 combined with the government shutdown created a 5 month decline in NFIB Small Business Optimism. With the government shutdown temporarily over and the stock market back up, we will probably see a slight improvement in NFIB Small Business Optimism over the next few months.
Click here for yesterday’s market study
Conclusion
Here is our discretionary market outlook:
- The U.S. stock market’s long term risk:reward is no longer bullish. This doesn’t necessarily mean that the bull market is over. We’re merely talking about long term risk:reward. Long term risk:reward is more important than trying to predict exact tops and bottoms.
- The medium term direction (i.e. next 6 months) is neutral. Some market studies are medium term bullish while others are medium term bearish
- The stock market’s short term has a bearish lean due to the large probability of a pullback/retest. Focus on the medium-long term (and especially the long term) because the short term is extremely hard to predict.
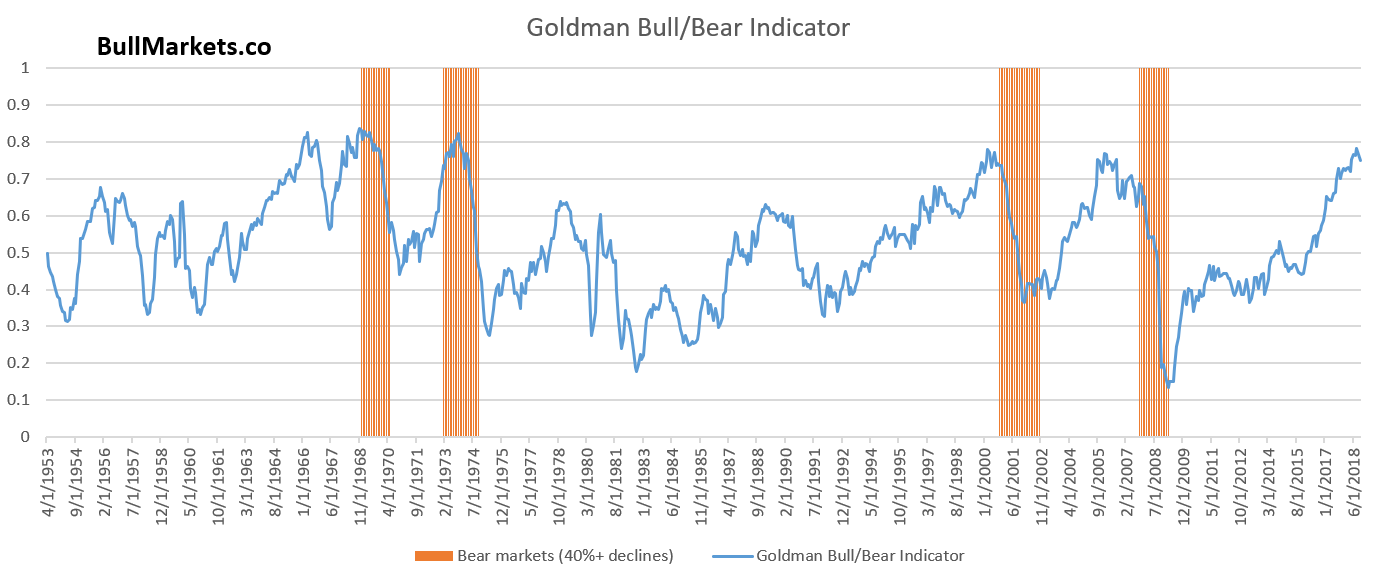
Goldman Sachs’ Bull/Bear Indicator demonstrates that while the bull market’s top isn’t necessarily in, risk:reward does favor long term bears.
Our discretionary outlook is not a reflection of how we’re trading the markets right now. We trade based on our quantitative trading models.
Members can see exactly how we’re trading the U.S. stock market right now based on our trading models.
Click here for more market studies
By Troy Bombardia
I’m Troy Bombardia, the author behind BullMarkets.co. I used to run a hedge fund, but closed it due to a major health scare. I am now enjoying life and simply investing/trading my own account. I focus on long term performance and ignore short term performance.
Copyright 2019 © Troy Bombardia - All Rights Reserved
Disclaimer: The above is a matter of opinion provided for general information purposes only and is not intended as investment advice. Information and analysis above are derived from sources and utilising methods believed to be reliable, but we cannot accept responsibility for any losses you may incur as a result of this analysis. Individuals should consult with their personal financial advisors.
© 2005-2022 http://www.MarketOracle.co.uk - The Market Oracle is a FREE Daily Financial Markets Analysis & Forecasting online publication.