


Long Awaited Stock Market Pullback has Finally Arrived
Stock-Markets / Stock Markets 2019 Mar 11, 2019 - 05:11 PM GMTBy: Troy_Bombardia

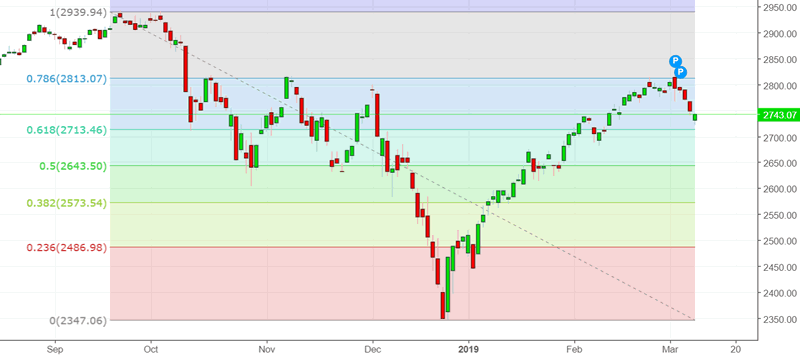
It was a tough week for the U.S. stock market, with the S&P falling 5 days in a row. The S&P is finally starting to make a somewhat sizable pullback, although this pullback happened later than we expected. Most pullbacks are start at the 50% retracement level – this one started at the 78.6% level, which proves that the short term is always extremely hard to predict.
Go here to understand our fundamentals-driven long term outlook.
Let’s determine the stock market’s most probable medium term direction by objectively quantifying technical analysis. For reference, here’s the random probability of the U.S. stock market going up on any given day.

*Probability ≠ certainty. Past performance ≠ future performance. But if you don’t use the past as a guide, you are blindly “guessing” the future.
Jobs Report
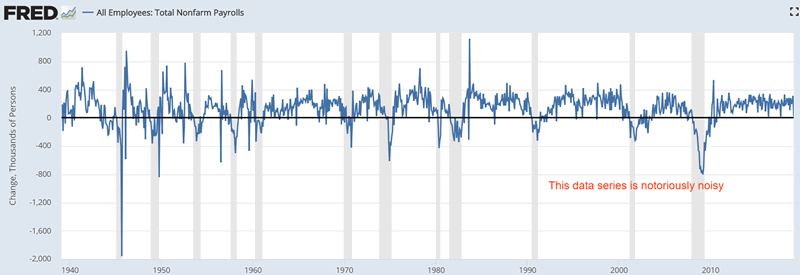
Today was Jobs Report day. Non-farm payrolls saw the biggest “miss” in expectations since 2008. Via another metric, non-farm payrolls saw the 2nd biggest monthly decline since 2008. Nonfarm payrolls growth fell -291k
While this may sound scary (anything with the world “financial crisis” or “2008” sounds scary), it isn’t.
Nonfarm payrolls is a notoriously noisy data series.
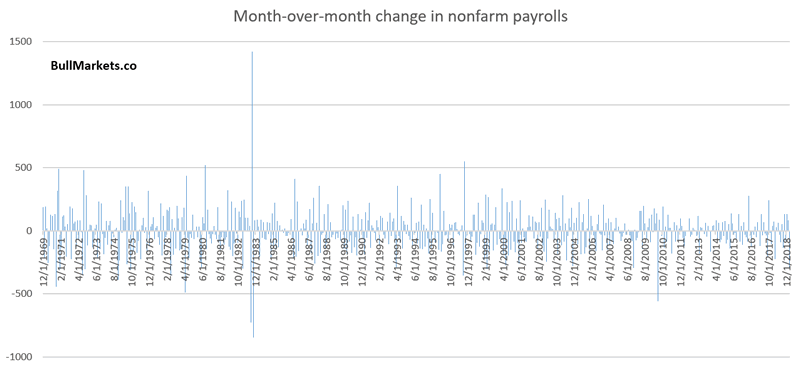
Monthly declines in Nonfarm Payrolls growth that exceeds -250k happens all the time.
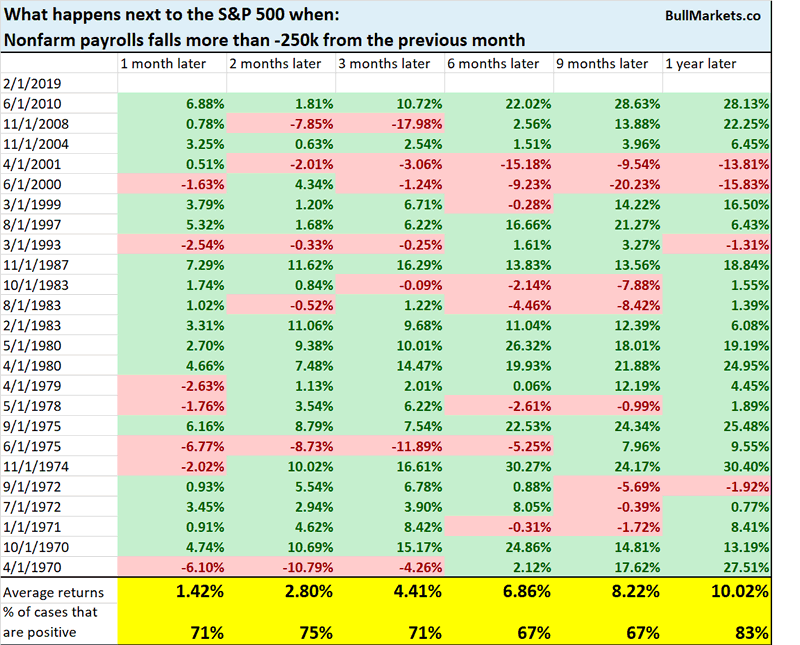
This happened 25 times from 1970 – present, and the S&P 500’s forward returns are no different from random.
Housing Starts
The latest reading for Housing Starts spiked from the previous reading. But more importantly, Housing Starts is still below its 12 month moving average. (The trend in economic data is always more important than individual data readings).
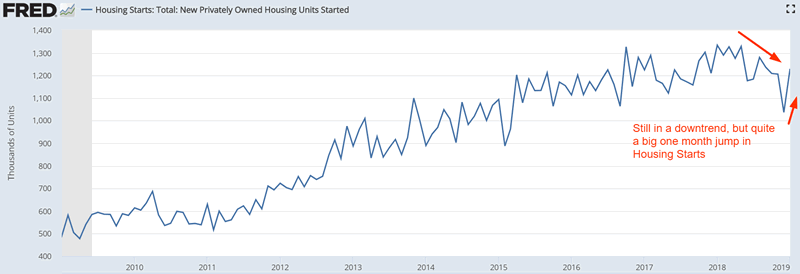
I came into this study expecting this factor to be bearish for the stock market. A lot of the biggest spikes in Housing Starts occur around a recession, when the economy is very volatile and Housing Starts is in a downtrend (i.e. below its 12 month moving average).
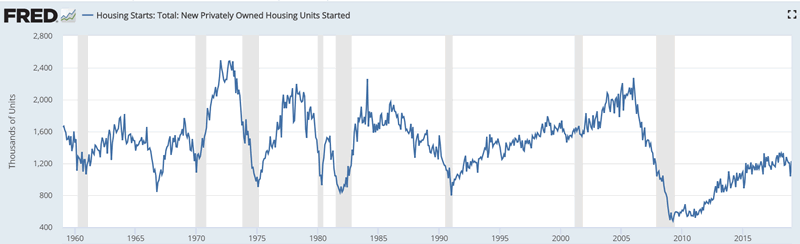
Surprisingly, the data suggested otherwise.
Here’s what happens next to the S&P when Housing Starts jumps more than 15% in one month, while it is still under its 12 month moving average.
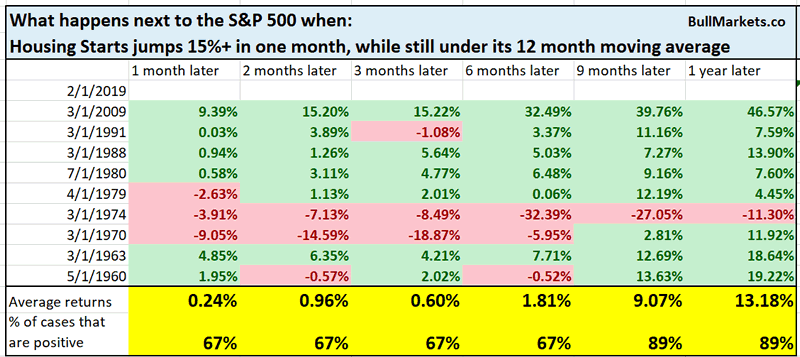
This is mostly bullish for stocks 9-12 months later. Even during bear markets, this often occurred towards the end of a bear market and economic recession.
Bearish engulfing pattern
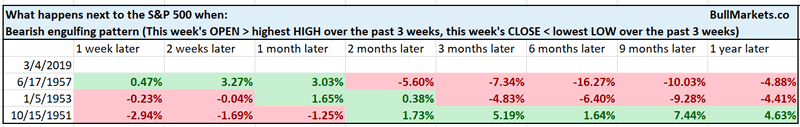
I’m not a big fan of chart patterns, but these are popular among traders. The S&P 500 printed a rare bearish engulfing pattern this week.
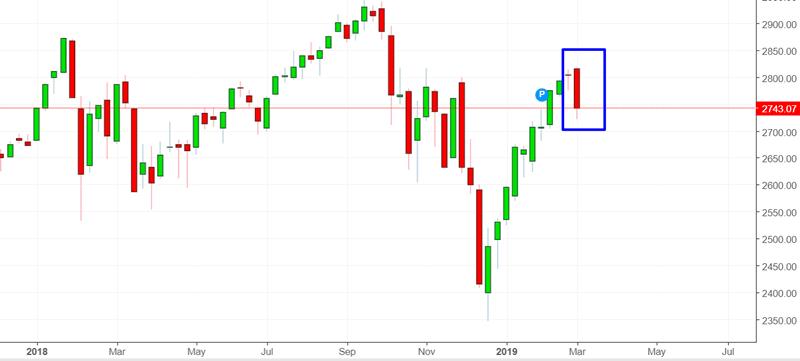
The S&P’s OPEN this week exceeded the highest HIGH over the previous 2 weeks, and the S&P’s CLOSE this week was lower than the lowest LOW over the previous 2 weeks. Textbook candlesticks called this a “bearish engulfing pattern”.
From 1950 – present, this has only happened 3 other times. It was indeed more bearish than bullish for the stock market going forward, but it’s hard to draw conclusions from a sample size of n=3
Insider selling
According to Bloomberg, corporate insiders have once again stepped up their selling. Simple contrarian analysis would automatically assume that this is bearish for stocks, but I wouldn’t. Just from a quick cursory glance, it’s clear that corporate insiders can be wrong. E.g. insiders sold a lot in early-2017.
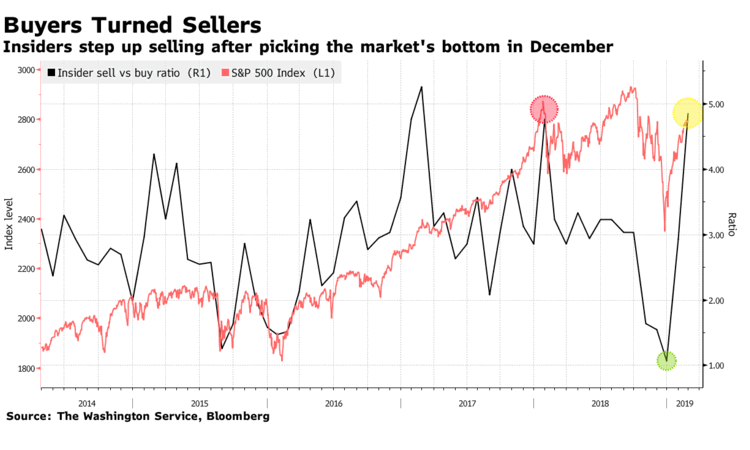
Generally speaking, there is no such thing as “smart money” or “dumb money” in the stock market. If the “dumb money” is too numerous, it can overpower the “smart money”. (This is also why sentiment is more useful and accurate at picking stock market bottoms than stock market tops).
Dow getting rare
The Dow Jones Transportation Index is now down 11 days in a row. Historically, the Dow Transportation Index’s forward returns were quite bearish.
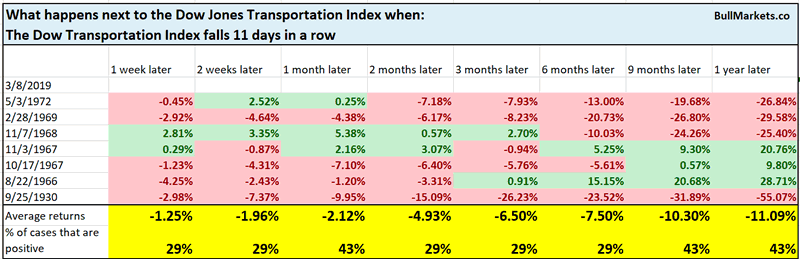
Examine these dates more closely and you can see that all of these were late-cycle dates.
- May 1972: 7 months before the bull market top
- 1966-1968: less than 2 years before the bull market top
- September 1930: in the middle of the 1929-1932 crash.
It seems that transports are leading the way down. Late-cycle
USD
The USD Index is making new highs, and is now up more than 8% over the past year. Meanwhile, the S&P 500 has gone nowhere.
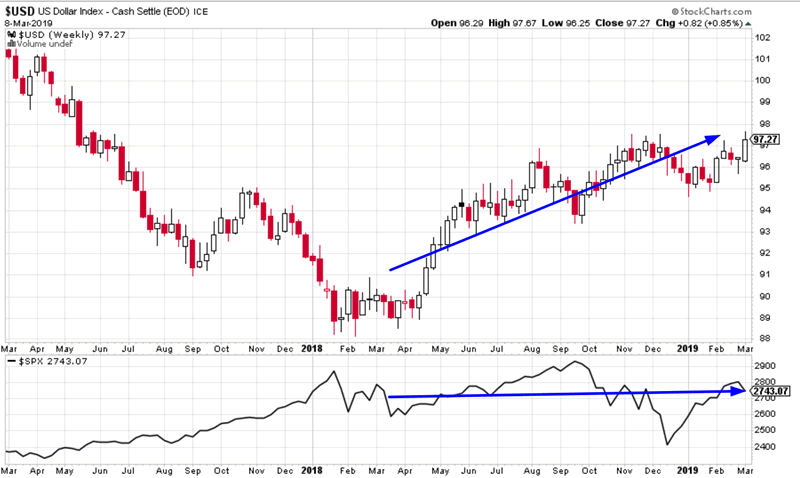
Here’s what happened next to the S&P when the USD Index goes up 8%+ over the past 52 weeks while the S&P falls.
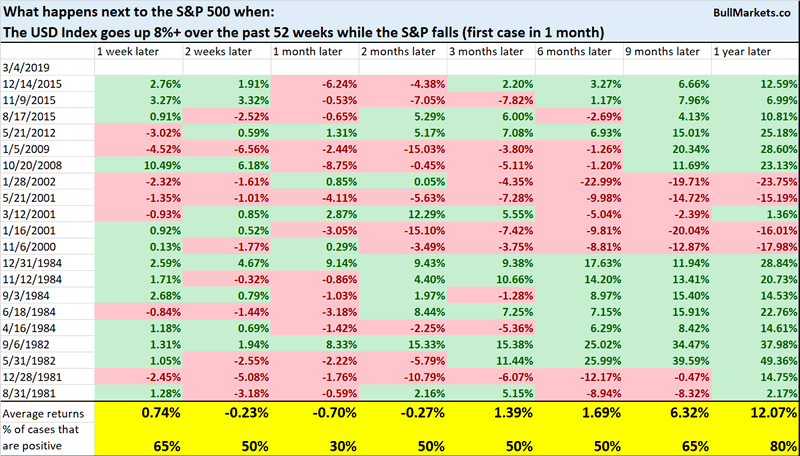
As you can see, this is a short term bearish factor for the S&P over the next 1 month
Click here for yesterday’s market analysis
Conclusion
Here is our discretionary market outlook:
- The U.S. stock market’s long term risk:reward is no longer bullish. In a most optimistic scenario, the bull market probably has 1 year left. Long term risk:reward is more important than trying to predict exact tops and bottoms.
- The medium term direction (e.g. next 6-9 months) is more bullish than bearish.
- The stock market’s short term has a bearish lean due to the large probability of a pullback/retest. Focus on the medium-long term (and especially the long term) because the short term is extremely hard to predict.
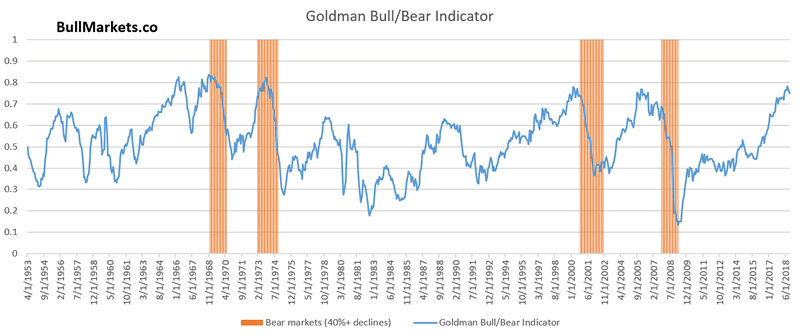
Goldman Sachs’ Bull/Bear Indicator demonstrates that while the bull market’s top isn’t necessarily in, risk:reward does favor long term bears.
Our discretionary market outlook is not a reflection of how we’re trading the markets right now. We trade based on our clear, quantitative trading models, such as the Medium-Long Term Model.
Members can see exactly how we’re trading the U.S. stock market right now based on our trading models.
Click here for more market studies
By Troy Bombardia
I’m Troy Bombardia, the author behind BullMarkets.co. I used to run a hedge fund, but closed it due to a major health scare. I am now enjoying life and simply investing/trading my own account. I focus on long term performance and ignore short term performance.
Copyright 2019 © Troy Bombardia - All Rights Reserved
Disclaimer: The above is a matter of opinion provided for general information purposes only and is not intended as investment advice. Information and analysis above are derived from sources and utilising methods believed to be reliable, but we cannot accept responsibility for any losses you may incur as a result of this analysis. Individuals should consult with their personal financial advisors.
© 2005-2022 http://www.MarketOracle.co.uk - The Market Oracle is a FREE Daily Financial Markets Analysis & Forecasting online publication.