


Dow Jones Stock Market Topping Pattern
Stock-Markets / Stock Markets 2019 Mar 20, 2019 - 06:00 AM GMTBy: Chris_Vermeulen

 Our research team believes a moderately mild price rotation will unfold over the next 30 to 60 days where the US Stock Market will rotate downward. Particularly, the $INDU (Dow Jones Industrials) should move lower towards the $23,000 to 24,000 before finding support based on the longer term weekly chart. Keep in mind we are not saying the price is going to fall. We are stating price could correct in a big way if recent support levels are broken. If so, then 23,000-24,000 levels should be reviewed.
We have been warning about a specific price pattern that we believe is currently in the process of setting up in the US Stock Market. This pattern is a “Falling Wedge” pattern. We’ve seen a few of these over the past 5+ years in downward retracing price swings. They typically act as a means for the price to explore a “momentum base” setup before breaking out to the upside. You can read our previous research here.
Price weakness could begin to drive market prices lower over the next few weeks as this right Shoulder acts as critical resistance. If you have not already prepared for this move, please try to understand the importance of this long term price pattern. Head-n-Shoulders patterns are typically viewed as major resistance and a classic topping formation. Our belief that the downside price swing from the right Shoulder is based on our predictive modeling systems results. We believe this move will drive prices lower before support is found and our downward sloping wedge pattern sets up. This wedge pattern will likely break to the upside during the Summer months.
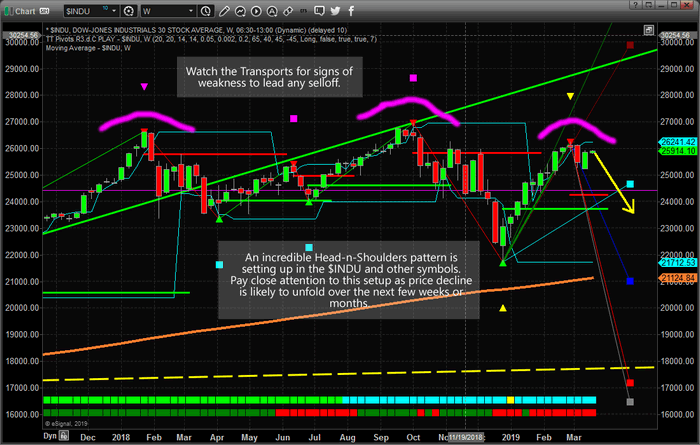
This Head-n-Shoulders pattern is something all traders need to pay attention to. This is a critical resistance/top formation that should drive prices lower over the next few weeks/months.
Just take a look at the daily chart and reversal type price action forming this week.
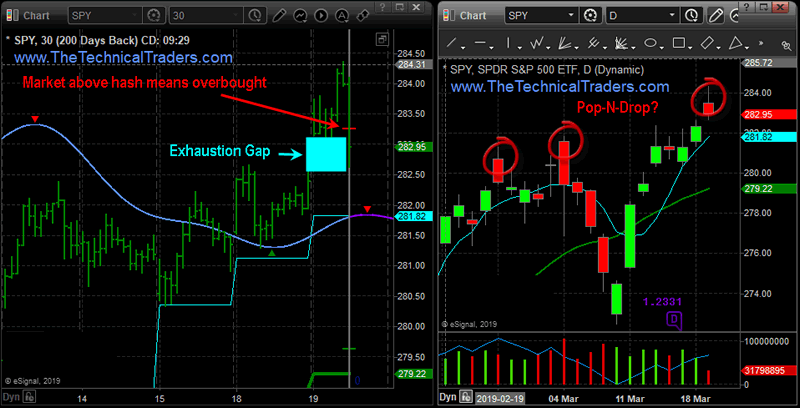
If you have not protected your long trades well enough or you have recently deployed a bunch of capital into the markets, we strongly suggest you develop a “Plan B” as we are likely to see a 5~10% correction before this downside swing is over.
Our team has 53 years of experience in researching and trading makes analyzing the complex and ever-changing financial markets a natural process. We have a simple and highly effective way to provide our customers with the most convenient, accurate, and timely market forecasts available today. Our stock and ETF trading alerts are readily available through our exclusive membership service via email and SMS text. Our newsletter, Technical Trading Mastery book, and 3 Hour Trading Video Course are designed for both traders and investors. Also, some of our strategies have been fully automated for the ultimate trading experience.
Chris Vermeulen
www.TheTechnicalTraders.com
Chris Vermeulen has been involved in the markets since 1997 and is the founder of Technical Traders Ltd. He is an internationally recognized technical analyst, trader, and is the author of the book: 7 Steps to Win With Logic
Through years of research, trading and helping individual traders around the world. He learned that many traders have great trading ideas, but they lack one thing, they struggle to execute trades in a systematic way for consistent results. Chris helps educate traders with a three-hour video course that can change your trading results for the better.
His mission is to help his clients boost their trading performance while reducing market exposure and portfolio volatility.
He is a regular speaker on HoweStreet.com, and the FinancialSurvivorNetwork radio shows. Chris was also featured on the cover of AmalgaTrader Magazine, and contributes articles to several leading financial hubs like MarketOracle.co.uk
Disclaimer: Nothing in this report should be construed as a solicitation to buy or sell any securities mentioned. Technical Traders Ltd., its owners and the author of this report are not registered broker-dealers or financial advisors. Before investing in any securities, you should consult with your financial advisor and a registered broker-dealer. Never make an investment based solely on what you read in an online or printed report, including this report, especially if the investment involves a small, thinly-traded company that isn’t well known. Technical Traders Ltd. and the author of this report has been paid by Cardiff Energy Corp. In addition, the author owns shares of Cardiff Energy Corp. and would also benefit from volume and price appreciation of its stock. The information provided here within should not be construed as a financial analysis but rather as an advertisement. The author’s views and opinions regarding the companies featured in reports are his own views and are based on information that he has researched independently and has received, which the author assumes to be reliable. Technical Traders Ltd. and the author of this report do not guarantee the accuracy, completeness, or usefulness of any content of this report, nor its fitness for any particular purpose. Lastly, the author does not guarantee that any of the companies mentioned in the reports will perform as expected, and any comparisons made to other companies may not be valid or come into effect.
Chris Vermeulen Archive |
© 2005-2022 http://www.MarketOracle.co.uk - The Market Oracle is a FREE Daily Financial Markets Analysis & Forecasting online publication.