


Your Future Stock Returns Might Unpleasantly Surprise You
Stock-Markets / Stock Market Valuations Mar 22, 2019 - 06:20 AM GMTBy: John_Mauldin

 Every investor knows that “past performance is not indicative of future results.” Yet many embrace century-long averages as a reasonable guess for future returns.
Back in the late 1990s, we were told that the long-term average return (~10%) was a reasonable long-term assumption. Instead, the S&P 500 Index has only gained about 3% annually since 1999—just over half the historical average.
This forced Baby Boomers to work longer and harder to retire, as well as save more of their income.
While the market has long periods of high returns, it has even more long period of low returns. Investors have seen entire decades delivering nothing but losses.
Understanding this is key to selecting the best securities and strategies.
The Market Usually Returns Less Than 10%
Let’s consider a reasonably long period.
For most investors, that period is a decade or two. If you are age 55 or over, 20 years starts to sound like the long run.
The stock market’s nominal long-term annualized total return has been around 10%. Total return includes capital gains as well as dividends.
The century-long 10% average is also close to the average annualized return across all 110 decadelong periods since 1900 (i.e., 1900–1909, 1901–1910, etc.).
Yet none of those decades delivered exactly 10%.
Of course, it’s naïve to think that a decade returns exactly the same single value. So let’s consider a range.
To be generous to the analysis, let’s say 8% to 12% represents a near-average range.
If most decades fall near this average, then we could assume the average is relevant. However, that’s not the case.
Only 21% of the decades since 1900 delivered an annual total return from the S&P 500 Index between 8% and 12%. Few were close to the 10% average.
Only about one-third of the periods showed a rate over 12%. And almost half of the periods showed less than 8% annual returns!
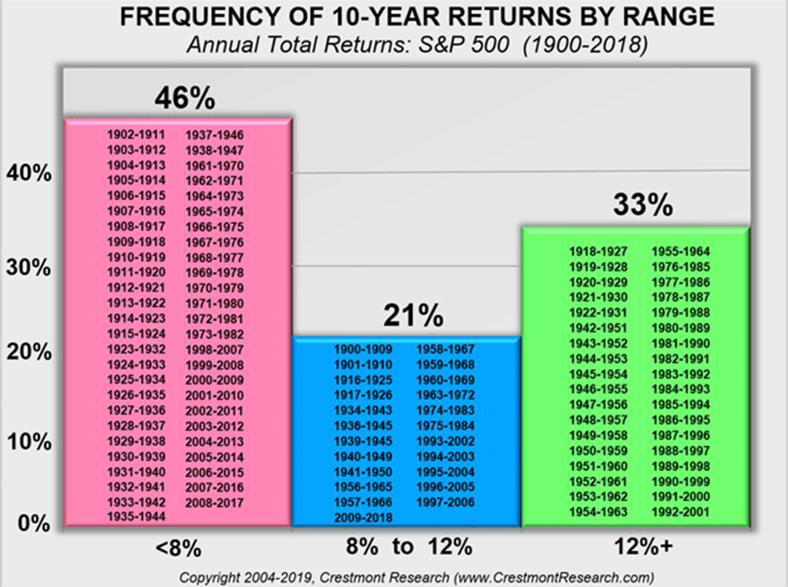
In other words, almost 80% of the decades are not near the average. That means using 10% as an assumption for the next decade or two is a long-shot bet.
Taking this analysis a step further, let’s explore the effect of relative valuation on returns.
Starting Valuation Matters
Stock market valuation is most often measured with the price/earnings ratio (P/E).
Across the 110 decadelong periods, the S&P 500’s annual returns ranged from -2% to 20%.
Some decadelong periods weren’t enough to ensure a gain. Four of them delivered losses, and even more when you consider inflation.
The next chart shows how starting valuations determine your returns for the next 10 years. As the market’s valuation rises, returns decline:
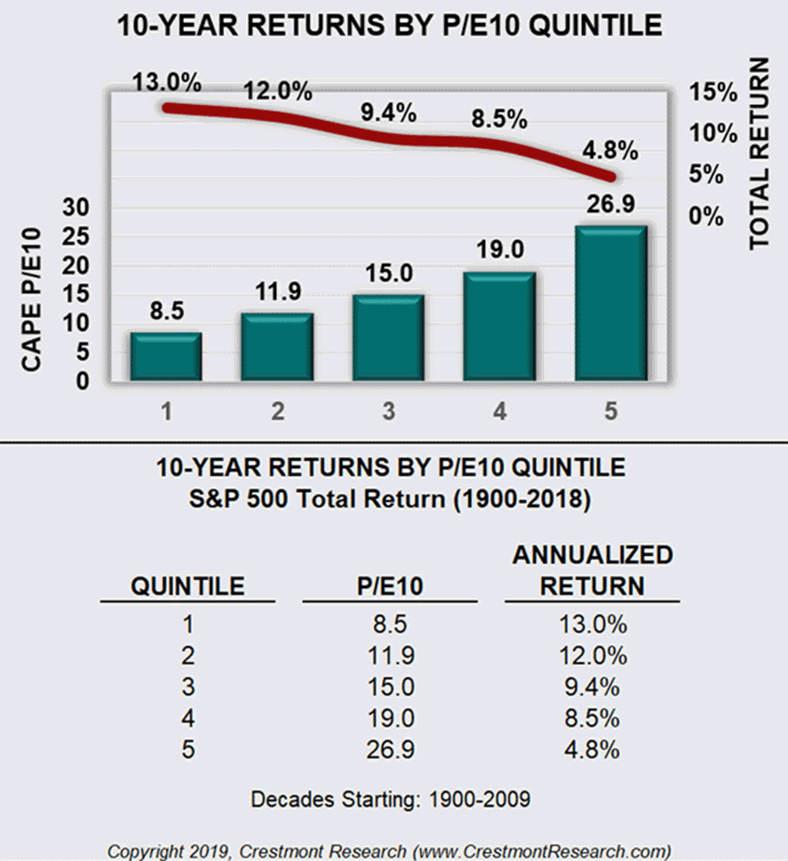
For example, the average P/E of 8.5 has brought in an average compounded annualized return of 13.5%. While the average P/E of 26.9 returned 4.8% on average.
There is some variation and occasional outliers within these quintiles. But when assessed in the aggregate, the relationship of valuation and subsequent return is strong.
Bottom line: starting valuation matter.
Manage Your Expectations
Now, here’s the problem.
Many financial advisors use a simple long-term average of the stock market to create retirement plans. They often assume a 7% or 8% growth in the equity portion of a portfolio—both before and after retirement.
The S&P 500 now sits at the second most overvalued point since 1964. Barring a miracle, no chance we can average 7-8% in the next couple of decades.
If your investment and retirement plans assume such results, I suggest you reconsider. Maybe find a financial planner or software program with a bit more sophistication.
Get one of the world’s most widely read investment newsletters… free
Sharp macroeconomic analysis, big market calls, and shrewd predictions are all in a week’s work for visionary thinker and acclaimed financial expert John Mauldin. Since 2001, investors have turned to his Thoughts from the Frontline to be informed about what’s really going on in the economy. Join hundreds of thousands of readers, and get it free in your inbox every week.
John Mauldin Archive |
© 2005-2022 http://www.MarketOracle.co.uk - The Market Oracle is a FREE Daily Financial Markets Analysis & Forecasting online publication.