


Kospi Stock Index Long Term Cycles Remain Bullish
Stock-Markets / South Korea Jul 08, 2019 - 03:14 PM GMT

The KOSPI Index in the long term has been trending higher with other world indices since inception in 1983. The index began with a base value set at 100 and trended higher until it ended that cycle in 1994. The index then corrected that cycle with the dip into 1998 lows during the Asian Financial Crisis. That is where the monthly chart pictured below begins. From the 1998 lows the index did three bullish swings higher into the November 2007 highs. The pullback from there until October 2008 was strong enough to suggest it was correcting the whole cycle up from the June 1998 lows.
Secondly I would like to mention this is a swing count. It is not an Elliott Wave count. As per the rules an impulse travels in the direction of the trend in 5-9 or 13 swings. When the bullish trend renewed to the April 2011 highs it reached the .618-.764 Fibonacci extension of the June 1998 to November 2007 cycle. This is a usual area for a 5th swing of a cycle. The 6th swing dip to the September 2011 lows corrected that cycle up from the October 2008 lows. The analysis continues below the chart.
Kospi Monthly Chart
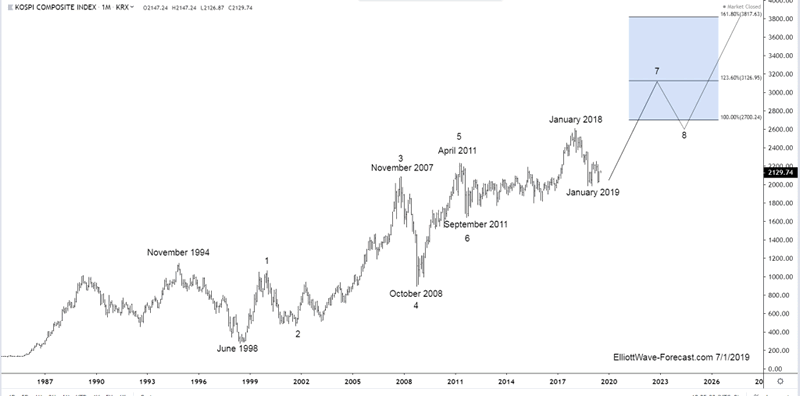
Thirdly, how these extension areas are measured. Take the Fibonacci extension tool on a charting platform. On this chart, point 1 will be at the beginning of the cycle at the 1998 lows. From there on up to the 2007 highs, marked with a 3, will be point 2. The point 3 will be down at the 2008 lows. This point is marked with a 4. The extension areas shown are the same as long as price remains above the 2008 lows. As previously mentioned from the 2008 lows the index has bounced in a 5th swing higher as well as correcting that bounce with the 2011 lows. From there the bounce higher into the April 2015 highs did not make new all time highs and the pullback into the August 2015 lows corrected that cycle from the 2011 lows.
Lastly in conclusion the bounce from the 2015 lows ended a cycle on January 2018 and the dip to the January 2019 lows corrected that cycle. It should in the near term remain above there. Until it gets back above the January 2018 highs another swing lower can not be ruled out. However the trend is up and the index should trade higher into the target area at 2700-3126+ area before it sees another pullback of similar magnitude as the one in 2011.
Thanks for looking. Feel free to come visit our website and check out our services Free for 14 days and see if we can be of help.
Kind regards & good luck trading.
Lewis Jones
By EWFHendra
https://elliottwave-forecast.com
ElliottWave-Forecast has built its reputation on accurate technical analysis and a winning attitude. By successfully incorporating the Elliott Wave Theory with Market Correlation, Cycles, Proprietary Pivot System, we provide precise forecasts with up-to-date analysis for 52 instruments including Forex majors & crosses, Commodities and a number of Equity Indices from around the World. Our clients also have immediate access to our proprietary Actionable Trade Setups, Market Overview, 1 Hour, 4 Hour, Daily & Weekly Wave Counts. Weekend Webinar, Live Screen Sharing Sessions, Daily Technical Videos, Elliott Wave Setup .
Copyright © 2019 ElliottWave-Forecast - All Rights Reserved Disclaimer: The above is a matter of opinion provided for general information purposes only and is not intended as investment advice. Information and analysis above are derived from sources and utilising methods believed to be reliable, but we cannot accept responsibility for any losses you may incur as a result of this analysis. Individuals should consult with their personal financial advisors.
© 2005-2022 http://www.MarketOracle.co.uk - The Market Oracle is a FREE Daily Financial Markets Analysis & Forecasting online publication.