


Silver Price Very Long-term
Commodities / Gold & Silver 2019 Jul 12, 2019 - 10:45 AM GMTBy: Gary_Tanashian

Just for fun because I am a chart guy who all too often bores you (and me) to death with ratio and indicator charts and all too seldom makes charts just for the fun of it anymore…
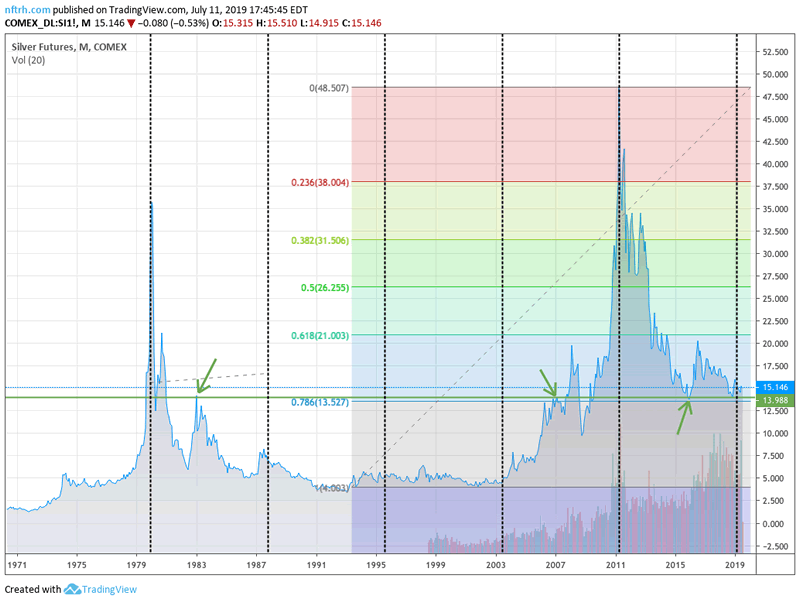
So this long-term silver chart is just for the fun of it. What do we have here?
- A very long-term Cup & Handle; and boy what a handle. It killed the true believers years ago. I like that the 2011 (bubble) right side high is higher than the 1980 (bubble) left side high (monthly closing basis).
- A price that has held a very long-term support level at 14, coinciding with a 79% Fib retrace (if you believe Fibs are relevant).
- Vertical cycle lines spaced around 8 years apart that have marked the two bubble highs, a minor high in the late 80s that led to a years-long trough, a whole lot of nothing in the mid-90s and the start of a massive bull market in 2003. The current line would appear to be a marker to a low.
- Yes, that thing from 2006 to today looks like an ugly Head & Shoulders pattern, so let’s give it its due as well. If I am wrong about an inflationary near future – and the Gold/Silver ratio still stands in defiance of an inflation trade on this day – you’d want to at least be aware of the bear’s potential.
- Another thing I don’t care for is the decade long trough that sprung the 2003 bull market vs. the much shorter flat period leading to today. Silver has certainly not had that level of desolation to its investment landscape since the most recent bubble popped in 2011.
So okay, there are at least two caution points if you want to take the long-term chart seriously.
That said, nothing’s changed. I am bullish on silver at this time and prepared to get more bullish if/when it takes over for gold. But obviously, that very important support around 14 that silver twice tested in the last year and three times tested in the last 5 needs to hold.
Final note: Daily charts inform the weeklies and both of those inform the big, lumbering monthlies. That is why so much you see on a big picture chart is either not actionable on a reasonable time frame or subordinate to what is going on with the shorter-term charts. We manage those closely each week in NFTRH. Not just for silver, gold and the miners, but for the whole US and global macro shootin’ match.
And if you haven’t noticed, things are getting interesting there. In the precious metals sure, but also in bonds/indicators and a little market I like to call the USS Good Ship Lollypop AKA the S&P 500, which is near our target now, but which has two very different options open from there.
Subscribe to NFTRH Premium (monthly at USD $33.50 or a 14% discounted yearly at USD $345.00) for an in-depth weekly market report, interim market updates and NFTRH+ chart and trade setup ideas, all archived/posted at the site and delivered to your inbox.
You can also keep up to date with plenty of actionable public content at NFTRH.com by using the email form on the right sidebar and get even more by joining our free eLetter. Or follow via Twitter ;@BiiwiiNFTRH, StockTwits or RSS. Also check out the quality market writers at Biiwii.com.
By Gary Tanashian
© 2019 Copyright Gary Tanashian - All Rights Reserved
Disclaimer: The above is a matter of opinion provided for general information purposes only and is not intended as investment advice. Information and analysis above are derived from sources and utilising methods believed to be reliable, but we cannot accept responsibility for any losses you may incur as a result of this analysis. Individuals should consult with their personal financial advisors.
Gary Tanashian Archive |
© 2005-2022 http://www.MarketOracle.co.uk - The Market Oracle is a FREE Daily Financial Markets Analysis & Forecasting online publication.