


Many Stock Investors & Traders Expect a Correction Over the Next Few Months
Stock-Markets / Stock Markets 2019 Jul 26, 2019 - 02:29 PM GMTBy: Troy_Bombardia

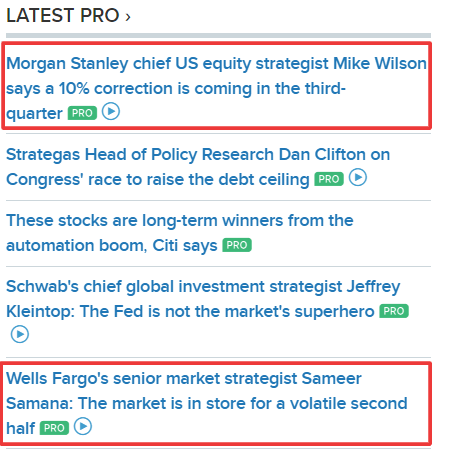
 After a big 7 month rally, many investors and traders are expecting a pullback/correction sometime in the next few months. This begs the question: if everyone thinks this way, will they all be right? Today’s headlines:
- A big 7 month rally.
- “The stock market today is just like 1998.”
- Volatility continues to fall.
- Semiconductors v-shaped recovery
- Gold:silver ratio continues to fall
- U.S. Dollar’s extremely low volatility
These headlines are from CNBC:
Go here to understand our fundamentals-driven long term outlook. For reference, here’s the random probability of the U.S. stock market going up on any given day.

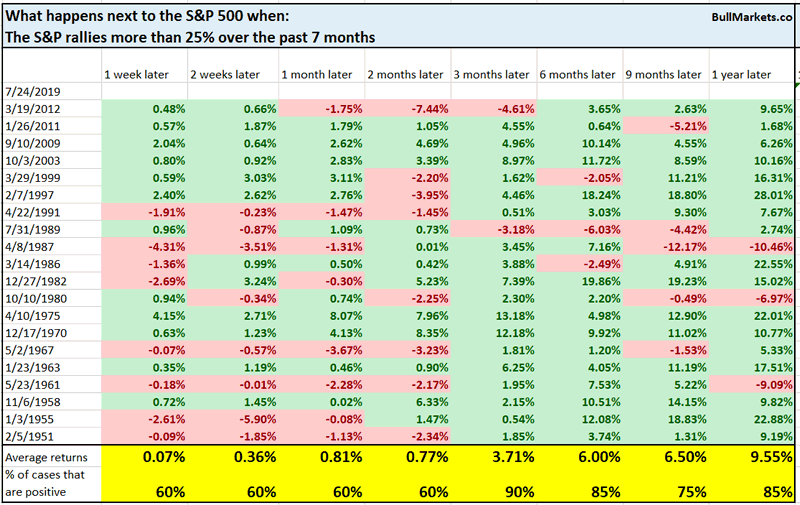
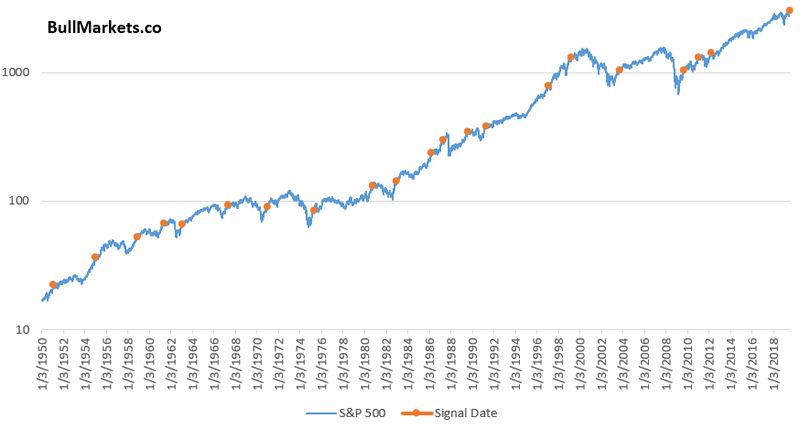
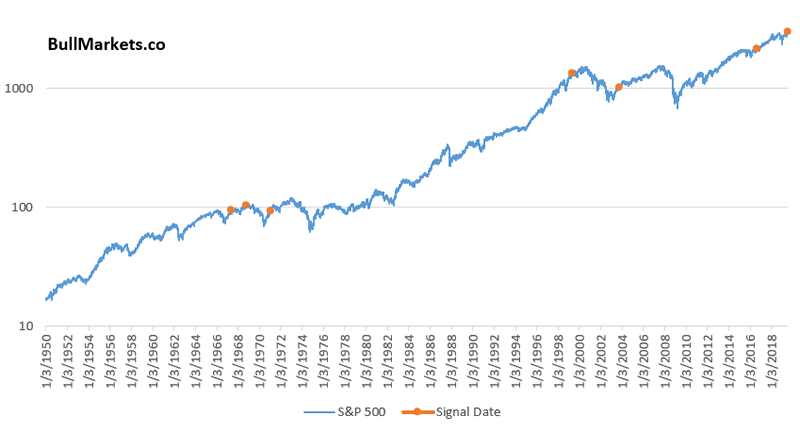
A big 7 month rally
It’s been 7 months since the December 24 low, and the S&P has rallied 25% since then.
After such a long rally, the next 1-2 months tend to be choppy. However, the stock market tends to do better 3-6 months later.
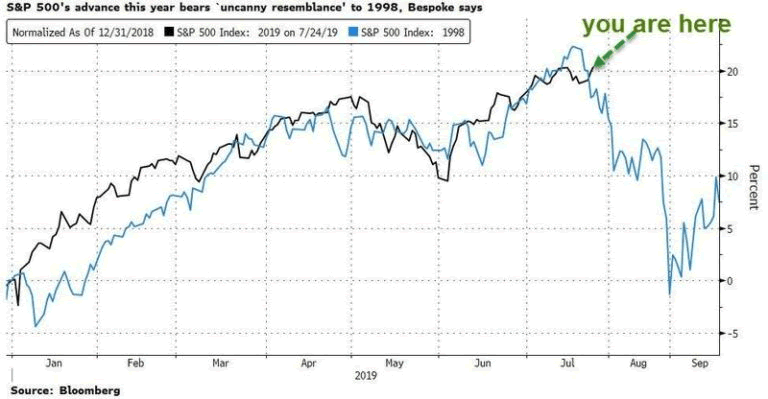
“The stock market today is just like 1998”
So apparently the S&P today looks “just like 1998”, according to Zerohedge.
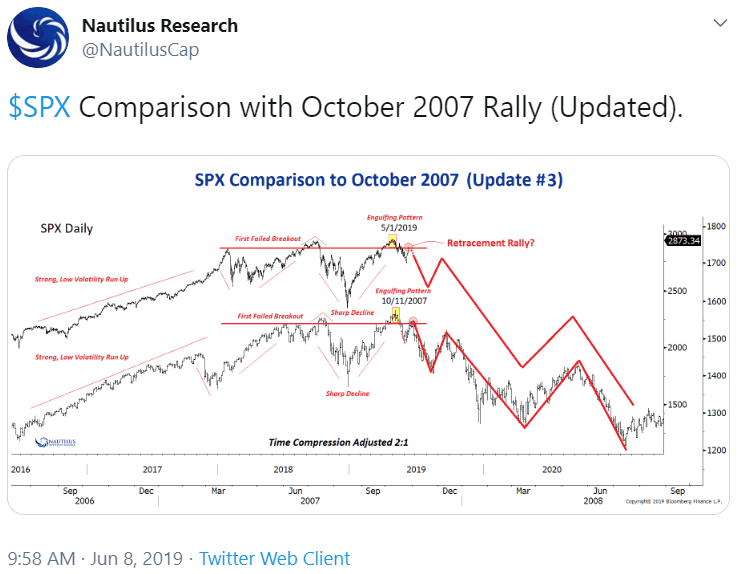
Which is funny because in June I was told that the S&P looked “just like 2007”
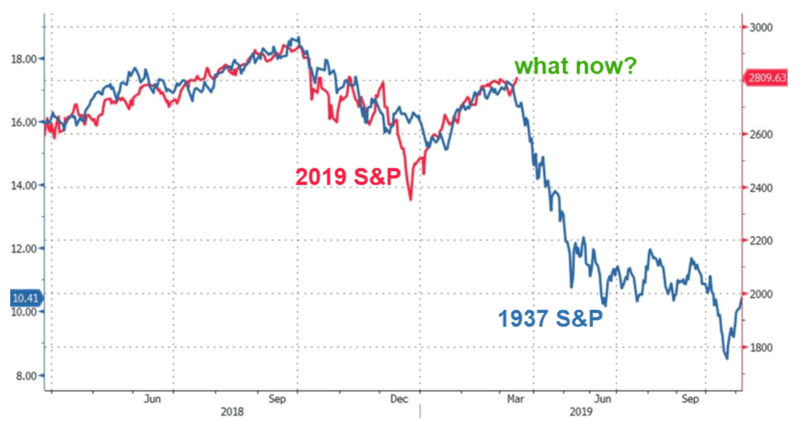
In March I was told that “today looks just like 1937”.
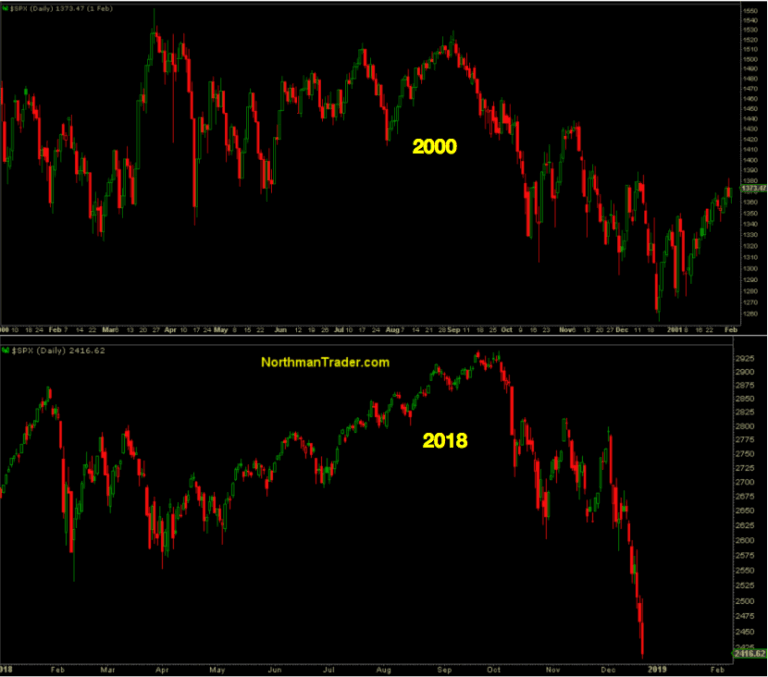
In December I was told that “today looks just like 2000”.
And more:
The vast majority of these analogues make no sense at all because the scales are changed, compressed, and stretched. Financial marketers use these as popular click-bait.
If you want to look at analogues, you should do so using a more objective method: correlations. We can compare the stock market’s past 10 months to historical 10 month periods, and find historical cases with high correlations.
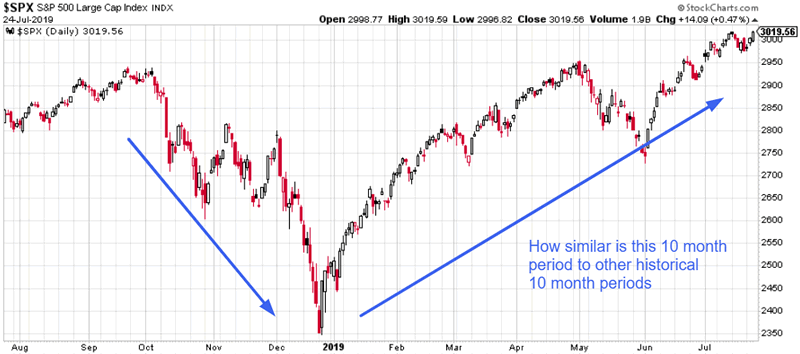
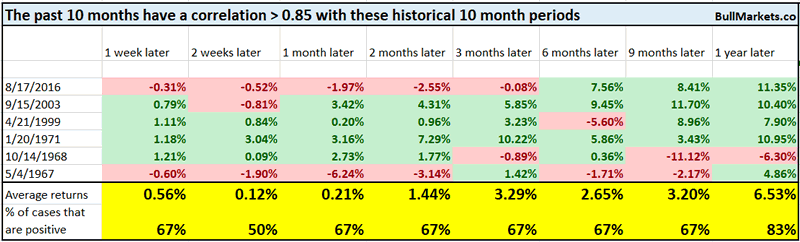
There are 6 other historical cases which saw a correlation of greater than 0.85. With the exception of 1968, the other historical cases saw more gains over the next year, even though the rally became more choppy and slowed down.
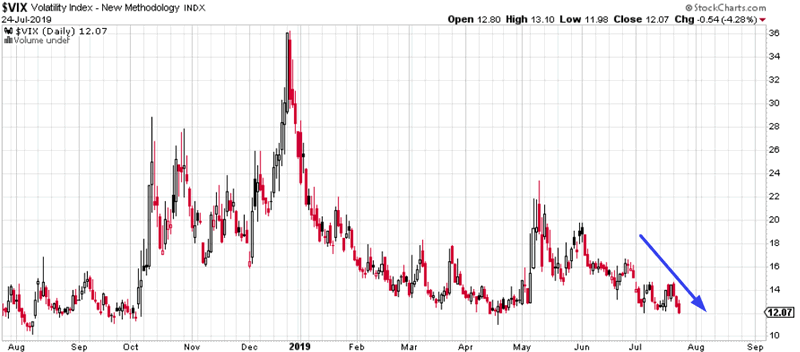
Volatility
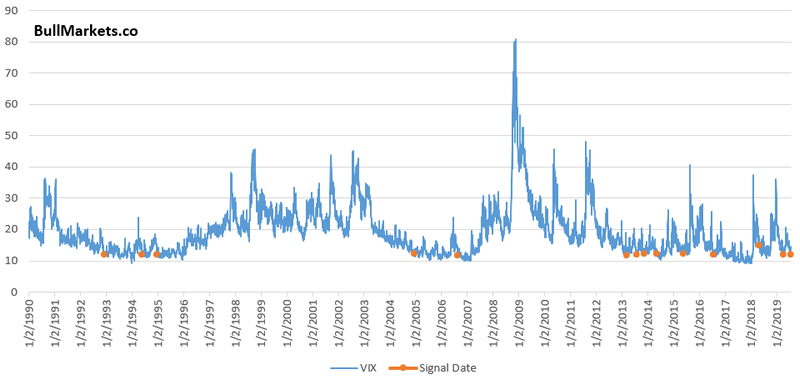
As the stock market rallies, volatility continues to fall. VIX fell below 12 today on the intraday, the first time since April.
In the past, low volatility was usually followed by short term choppiness in the S&P (next few weeks) but longer term gains (6-12 months later)…
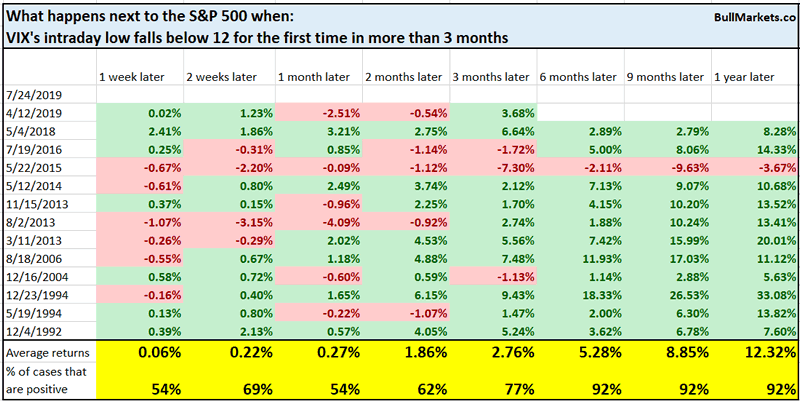
… and was mostly bullish for VIX over the next week and 3 months later.
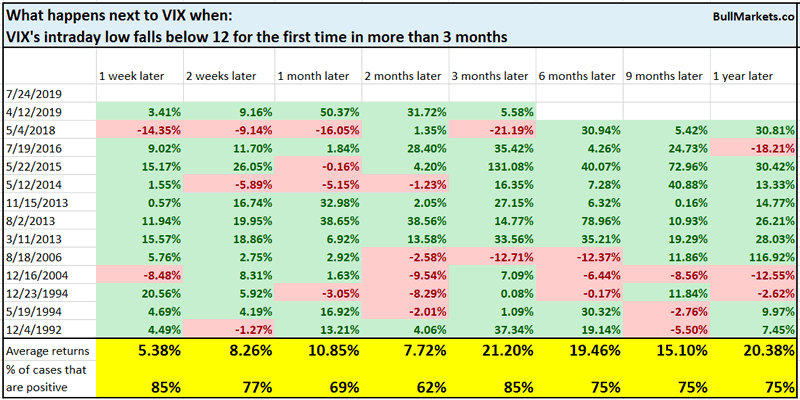
It’s hard to sustain a long period of low volatility.
Semiconductors
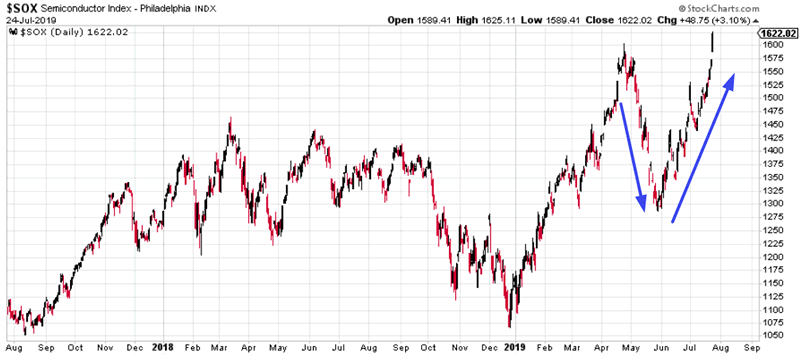
Semiconductors have made a V-shaped recovery, according to The Chart Report:
V-shaped recoveries in semiconductors often see some short term weakness. Here’s what happened next to the Semiconductor Index when it fell more than -15% within 2 months and then rallied more than +25% within the next 2 months.
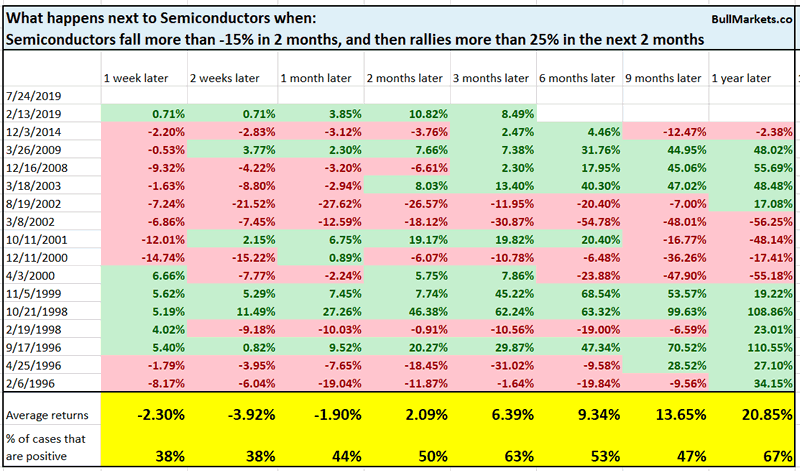
Forward returns over the next few weeks are more bearish than random.
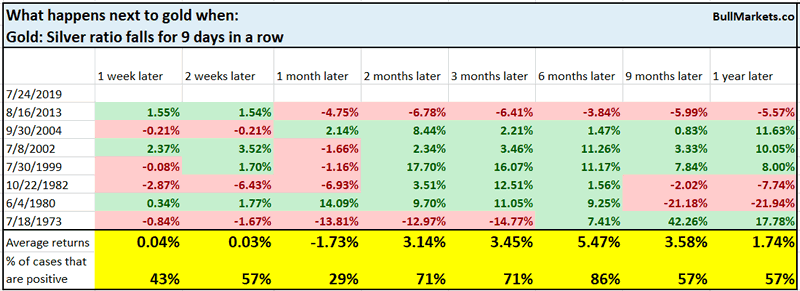
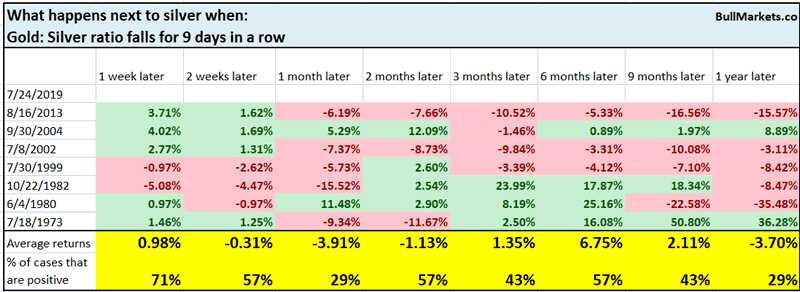
Gold and silver
Silver continues to rally, causing the gold:silver ratio to fall 9 days in a row.
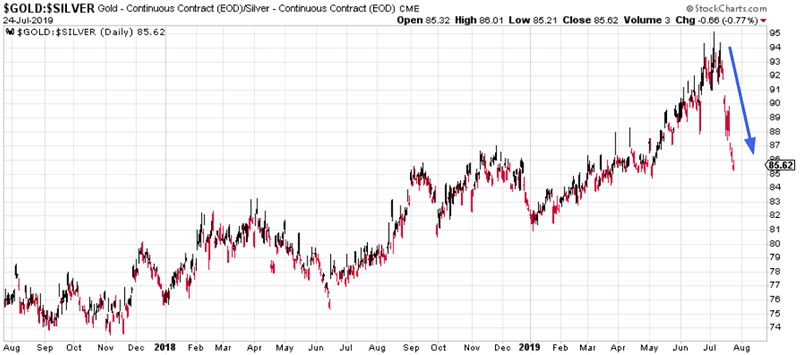
There are only 7 similar historical cases. Most of these saw gold and silver perform poorly over the next month, with gold outperforming silver over the next year.

U.S. Dollar
And lastly, Callum Thomas from Top Down Charts posted an interesting chart on FX Volatility, which is extremely low right now.
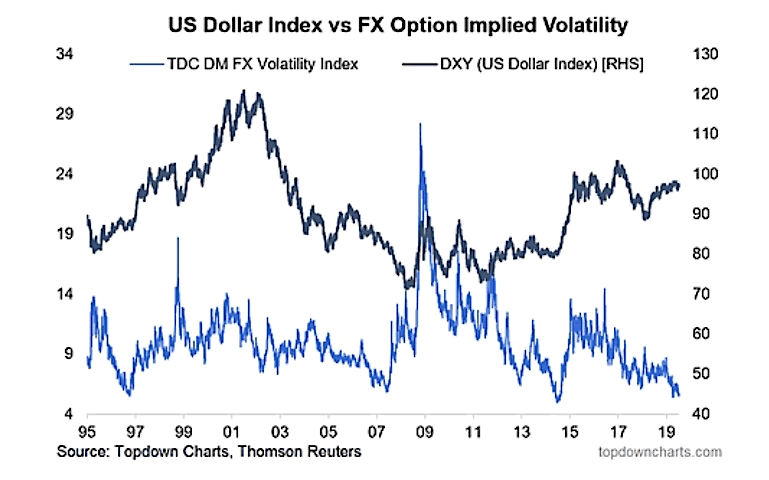
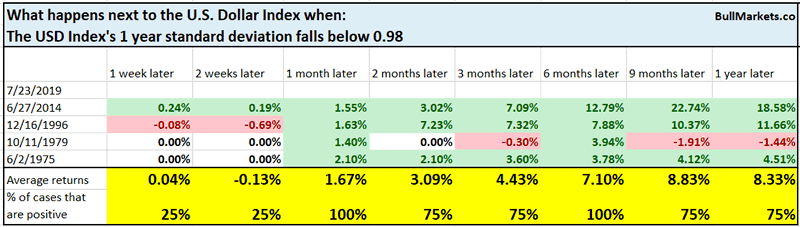
There’s a simpler way to look a the USD Index’s volatility – just take the USD’s 1 year standard deviation.
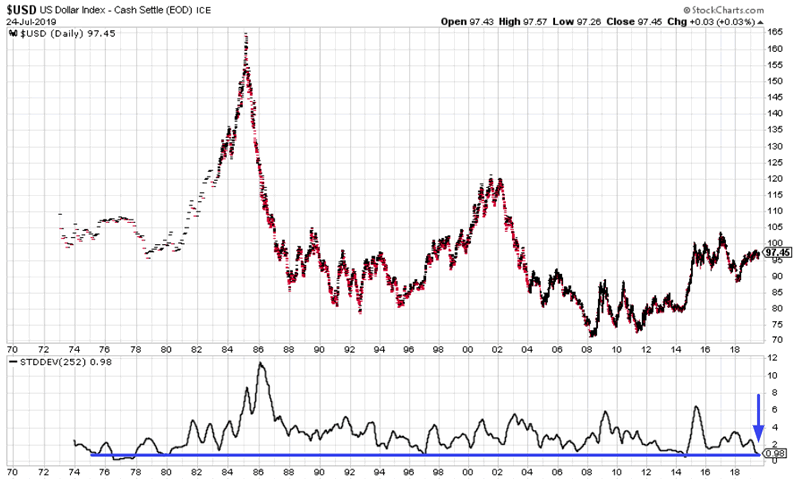
Once again, this demonstrates that the USD’s volatility is quite low. There are only 4 other similar historical cases, all of which saw the USD do well over the next 1-6 months.
A rising USD was not consistently bearish for stocks.
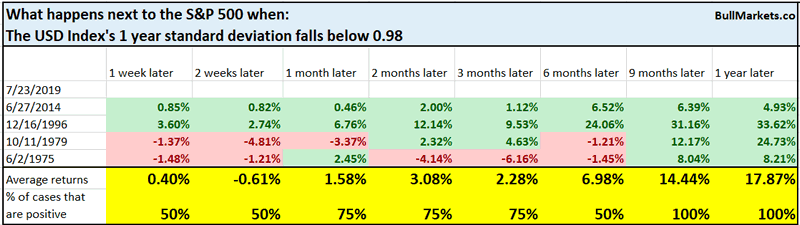
*N=4, so take this with a grain of salt.
We don’t use our discretionary outlook for trading. We use our quantitative trading models because they are end-to-end systems that tell you how to trade ALL THE TIME, even when our discretionary outlook is mixed. Members can see our model’s latest trades here updated in real-time.
Conclusion
Here is our discretionary market outlook:
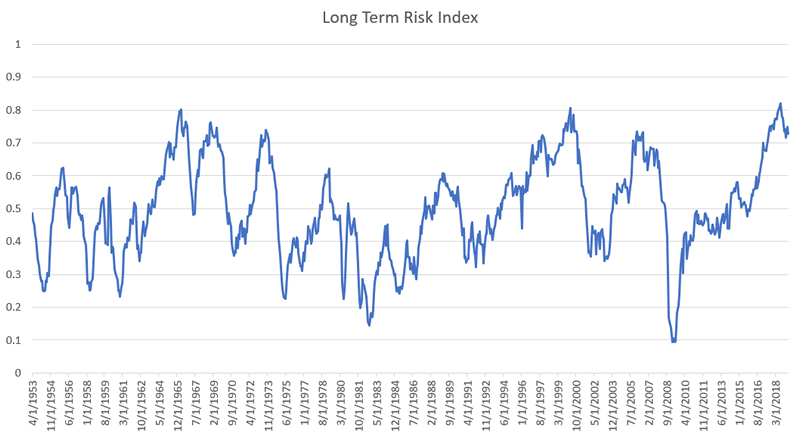
- Long term: risk:reward is not bullish. In a most optimistic scenario, the bull market probably has 1 year left.
- Medium term (next 6-9 months): most market studies are slightly bullish.
- Short term (next 1-3 months) market studies lean bearish.
- We focus on the medium-long term.
Goldman Sachs’ Bull/Bear Indicator demonstrates that risk:reward does favor long term bears.
Click here for more market studies
By Troy Bombardia
I’m Troy Bombardia, the author behind BullMarkets.co. I used to run a hedge fund, but closed it due to a major health scare. I am now enjoying life and simply investing/trading my own account. I focus on long term performance and ignore short term performance.
Copyright 2019 © Troy Bombardia - All Rights Reserved
Disclaimer: The above is a matter of opinion provided for general information purposes only and is not intended as investment advice. Information and analysis above are derived from sources and utilising methods believed to be reliable, but we cannot accept responsibility for any losses you may incur as a result of this analysis. Individuals should consult with their personal financial advisors.
© 2005-2022 http://www.MarketOracle.co.uk - The Market Oracle is a FREE Daily Financial Markets Analysis & Forecasting online publication.