


US Stock Market Hasn’t Cleared The Storm Yet
Stock-Markets / Stock Markets 2019 Sep 08, 2019 - 02:38 PM GMTBy: Chris_Vermeulen

 As much as we would like to report that the US Stock market has recently cleared the future concerns of a global economic recession as well as expanded into a new growth phase, we simply can’t make that claim give the data we are seeing from our proprietary price modeling systems. Overall, this final quarter of 2019, and early into 2020, may shape up to be a very volatile period in the global markets.
Before we get into the details, be sure to opt-in to my Free Market Forecast and Trade Ideas Newsletter so stay on top of these market moves.
Recently, we posted a research post highlighting the price structure of the ES and TRAN charts that continue to suggest price weakness is still driving overall price rotation. The TRAN chart is very telling currently as it shows much more substantial price weakness in comparison to the ES, NQ, and YM charts. We believe the continued price strength is seen in the ES, NQ, and YM charts is related to the continued “Capital Shift” where foreign investors are still pouring capital into the US markets believing they are the safest and most secure investments for the future.
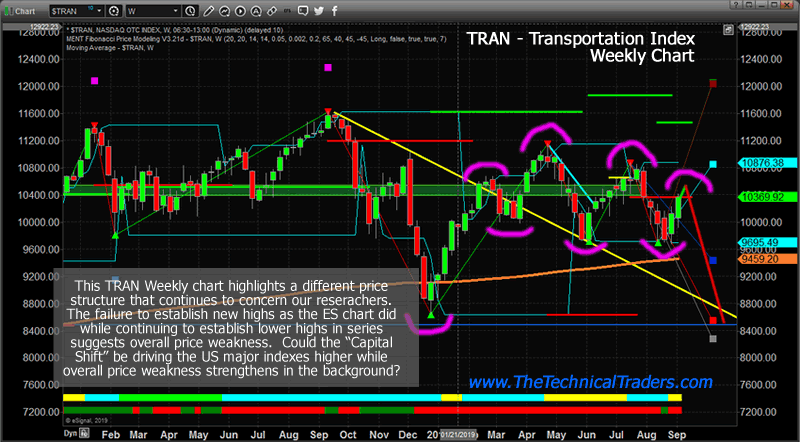
The divergence between our custom indicators and market analysis tools in relation to the support in the US major markets (the ES, NQ, and YM) continues to present a very interesting dynamic regarding the future expectations of true price value. Either the US major markets are overvalued in relation to price weakness shown by other factors (our custom indicators and modeling systems) or our custom indicators are undervaluing the strengths of the “capital shift” process that is taking place throughout the globe.
In our opinion, the single most important aspect of true technical analysis and price structure is that price MUST confirm a renewed upward price trend/bias before we can consider the risks of a price correction invalid. At this time, we don’t believe we are “Out Of The Woods” yet in terms of identifying this type of upside price validation – let’s take a look at some charts.
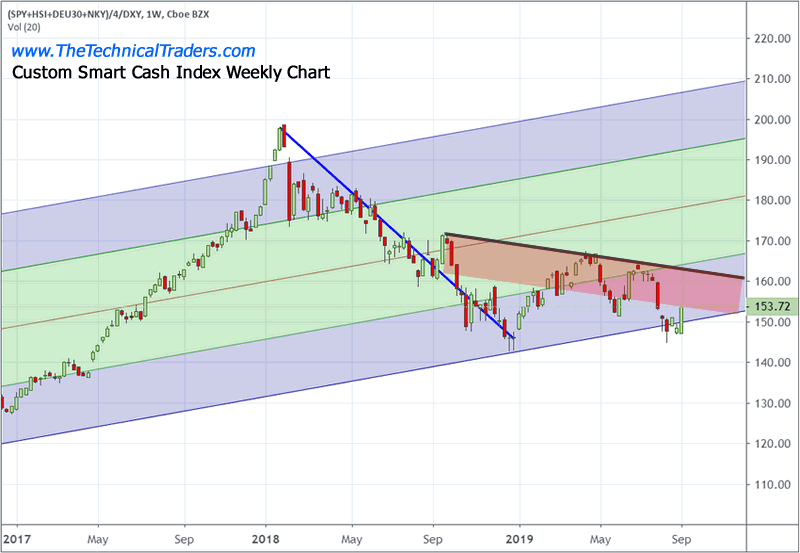
This Custom Smart Cash Index Weekly chart highlights the recent upside price swing related to the multiple news events from last week (BREXIT, China & Earnings). We can see how price briefly broke through the lower channel of historical price trends and appeared to be setting up a potential breakdown event. Yet, the news items last week resulted in a “reprieve” upside price move that pushed our Custom Smart Cash Index back into the lower channel range.
Obviously, this move does not constitute a new Bullish price trend based on the data from this chart. We have yet to break the downward price cycle, highlighted by the BLACK trend line, as well as the Price Weakness Zone, highlighted by the RED SHADED area. Ultimately, if the global markets were to break this downward price channel to the upside, then we would have some technical confirmation that a new bullish rally is really taking place. As of right now, we don’t have that type of confirmation.
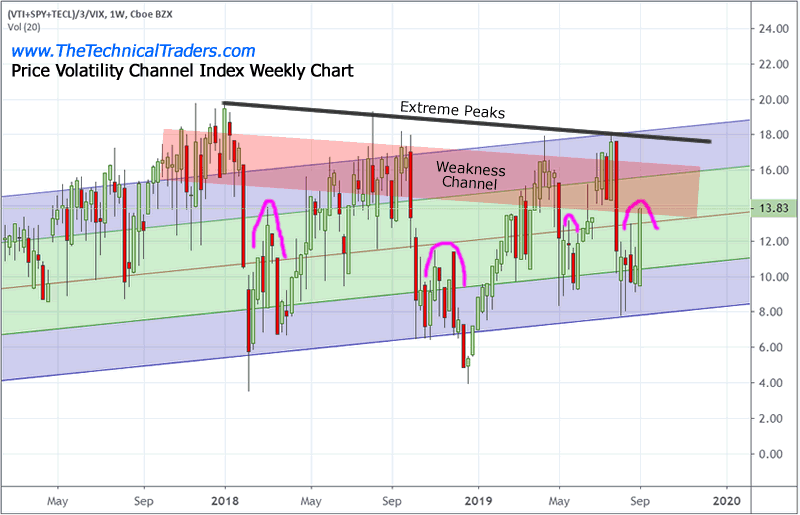
This Custom Price Volatility Channel Index Weekly chart highlights another concern we have related to the future capabilities of any real upside price move. Remember to keep in mind the data from the Smart Cash Index chart as we move forward through this analysis.
The Custom Price Volatility Channel Index chart is showing that price has “recovered” back into the normal price range zone (the center green zone). In fact, the upside move last week put this Custom Volatility Index value into the upper “normal” price zone and into a “Weakness Channel” which is where early price “topping” formations typically occur. The Extreme Peaks level is where the ultimate high price top happens. The Weakness Channel is where price initially runs into the first levels of resistance and begins to become more volatile – at least recently.
We’ve highlighted a number of deeper price rotations in MAGENTA that shows what we believe may be setting up in the US/Global markets right now. In the past, we’ve witnessed these types of “brief recoveries” in the Volatility Channel Index a number of times just before a deeper price move breaks out pushing the price towards an ultimate low price rotation.
You can see the first example of this in February 2018, where a very deep low price level was reached, followed by a reprieve, then another attempt to reach new lows in April 2018 (the ultimate bottom). And again in October 2019 as the price began the downside move that ended near Christmas 2019. The initial downside move pushed the Volatility Index very near to the lower price channel levels, then a brief reprieve happened, then another deeper price move toward the ultimate low/bottom. This pattern continues even with the minor price rotation in April 2019. The initial downside move reached into the lower volatility zone pauses then rotates back into the lower zone to set up the “ultimate bottom” in early June 2019.
What will this current rotation look like if it follows the same pattern? From these current levels, it would have to collapse back into the lower price channel (possibly below it) and would attempt to setup an “ultimate price bottom” at some point in the future?
This begs the question – are we just starting a bigger breakdown event?
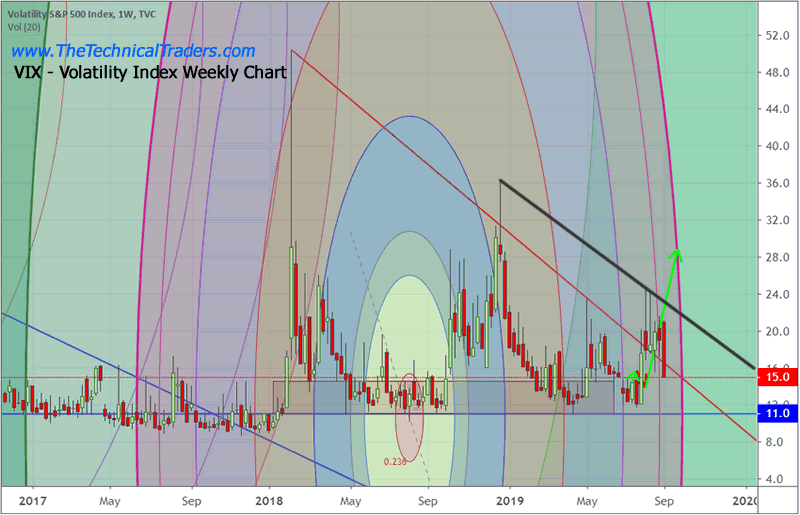
The VIX, S&P Volatility Index, Weekly chart continues to tighten below 20 – which is an extremely high level historically for the VIX. In the old days, just a few months back, we would consider a tight VIX somewhere below 11 or so. Now, it is below 15~20. Volatility is certainly increasing as price range and rotation have increased.
Still, our proprietary Fibonacci Price Amplitude Arcs suggest a major inflection point is set up to happen near the end of September (the week of September 30). These price amplitude arcs are based on a combination of Fibonacci price theory and a Nikola Tesla theory called “Mechanical Resonance”. Tesla’s theory was that all things operate as energy and because of that – all things have a natural resonant frequency and amplitude level. If we are able to tune into that frequency and amplitude level, then we will be able to harness the power of that item and the associated items around it. This is because all things are related to the energy produced by surrounding items. It may be tough to understand right now – but try to think of it as the “hidden resonant frequency and amplitude of price action”. Look at the arcs on this chart and try to see how the peaks, trends, and troughs align very closely with these arc levels.
What this means is that September 30 is setting up to become a potentially big inflection point for the VIX/major markets. Prior to that time, we would expect the VIX to prepare for this inflection point by attempting to “base” near true levels.
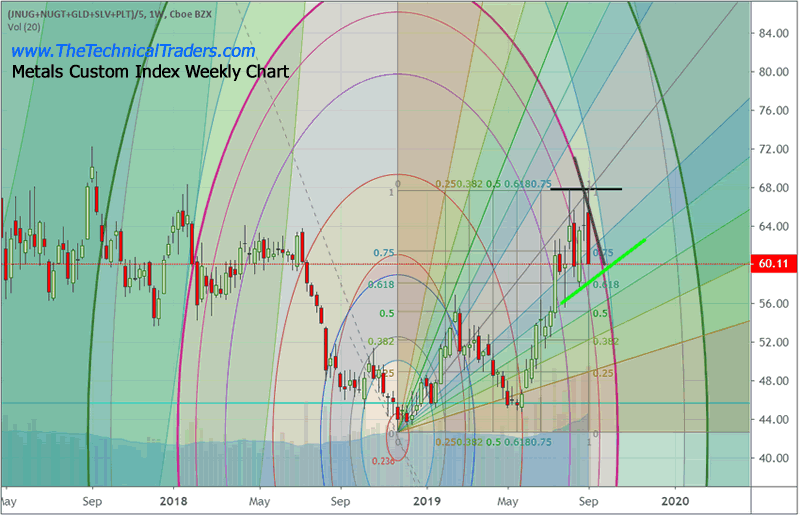
Lastly, our Custom Metals Index Weekly chart. A number of technical conditions are setting up in this chart – first, the resistance near 68 has set up a double-top pattern. Thus, if metals continue to push higher, once this chart breaks the 68 level, we could see a very big move to the upside. Second, the Fibonacci Price Amplitude Arcs are continuing to align with the September 30 inflection point. Therefore, we have further evidence that the end of September could become a very interesting opportunity for skilled technical traders. Lastly, we believe the upward slope highlighted by the GREEN trend line is the key support level for this Custom Metals Index. Therefore, looking for opportunities to find new Long Entries near or below this level would be ideal.
If our analysis is correct, precious metals will continue to rally well into the end of 2019 and into 2020. Timing these trades are critical. The volatility of the metals markets has increased by nearly 100% from earlier this year. This means bigger risks and bigger profits as the price range has nearly doubled in the average range. Pay attention to these opportunities as they set up and please be cautious of “loading up” because of any one trigger. This is a market where skills, risk management, position sizing and timing your trades are going to make a big difference for you.
CONCLUDING THOUGHTS:
In closing, we believe we are not out of the woods just yet. We believe the price movement near or after September 30 will be key to understanding what will happen throughout the remainder of 2019 and into 2020. If our analysis is correct, we believe the price trend set up on or after the September 30 inflection point will prompt a very big price move in the global markets.
Play it safe right now. Don’t get over-confident in your trades and learn to manage your risks accordingly. It is very likely that we are going to see a bit of price consolidation, possibly into a Pennant/Flag formation, over the next 15+ trading days as we near the September 30 inflection point. At this point, we have to wait and watch what happens next and watch for any early warning signs across the markets (like the Transportation Index).
Be prepared for these incredible price swings before they happen and learn how you can identify and trade these fantastic trading opportunities in 2019, 2020, and beyond with our Wealth Building & Global Financial Reset Newsletter.
Join me with a 1 or 2-year subscription to lock in the lowest rate possible and ride my coattails as I navigate these financial market and build wealth while others lose nearly everything they own during the next financial crisis. Join Now and Get a 1oz Silver Round or Gold Bar Shipped To You Free.
Before we get into the details, be sure to opt-in to my Free Market Forecast and Trade Ideas Newsletter so stay on top of these market moves.
I can tell you that huge moves are about to start unfolding not only in currencies, metals, or stocks but globally and some of these supercycles are going to last years. A gentleman by the name of Brad Matheny goes into great detail with his simple to understand charts and guide about this. His financial market research is one of a kind and a real eye-opener. 2020 Cycles – The Greatest Opportunity Of Your Lifetime
As a technical analysis and trader since 1997, I have been through a few bull/bear market cycles. I believe I have a good pulse on the market and timing key turning points for both short-term swing trading and long-term investment capital. The opportunities are massive/life-changing if handled properly.
NOTICE : Our free research does not constitute a trade recommendation or solicitation for our readers to take any action regarding this research. It is provided for educational purposes only. Our research team produces these research articles to share information with our followers/readers in an effort to try to keep you well informed. If you want detailed trade signals complete with entry, targets and stop, join our trading newsletter today.
FREE GOLD OR SILVER WITH SUBSCRIPTION!
Chris Vermeulen
www.TheTechnicalTraders.com
Chris Vermeulen has been involved in the markets since 1997 and is the founder of Technical Traders Ltd. He is an internationally recognized technical analyst, trader, and is the author of the book: 7 Steps to Win With Logic
Through years of research, trading and helping individual traders around the world. He learned that many traders have great trading ideas, but they lack one thing, they struggle to execute trades in a systematic way for consistent results. Chris helps educate traders with a three-hour video course that can change your trading results for the better.
His mission is to help his clients boost their trading performance while reducing market exposure and portfolio volatility.
He is a regular speaker on HoweStreet.com, and the FinancialSurvivorNetwork radio shows. Chris was also featured on the cover of AmalgaTrader Magazine, and contributes articles to several leading financial hubs like MarketOracle.co.uk
Disclaimer: Nothing in this report should be construed as a solicitation to buy or sell any securities mentioned. Technical Traders Ltd., its owners and the author of this report are not registered broker-dealers or financial advisors. Before investing in any securities, you should consult with your financial advisor and a registered broker-dealer. Never make an investment based solely on what you read in an online or printed report, including this report, especially if the investment involves a small, thinly-traded company that isn’t well known. Technical Traders Ltd. and the author of this report has been paid by Cardiff Energy Corp. In addition, the author owns shares of Cardiff Energy Corp. and would also benefit from volume and price appreciation of its stock. The information provided here within should not be construed as a financial analysis but rather as an advertisement. The author’s views and opinions regarding the companies featured in reports are his own views and are based on information that he has researched independently and has received, which the author assumes to be reliable. Technical Traders Ltd. and the author of this report do not guarantee the accuracy, completeness, or usefulness of any content of this report, nor its fitness for any particular purpose. Lastly, the author does not guarantee that any of the companies mentioned in the reports will perform as expected, and any comparisons made to other companies may not be valid or come into effect.
Chris Vermeulen Archive |
© 2005-2022 http://www.MarketOracle.co.uk - The Market Oracle is a FREE Daily Financial Markets Analysis & Forecasting online publication.