


Stock Market Price Structure Still Suggests We Are Within Volatile Rotation
Stock-Markets / Stock Markets 2019 Sep 09, 2019 - 06:43 PM GMTBy: Chris_Vermeulen

 This shortened holiday week has been full of crazy price rotation, political intrigue, surprise news events and, we are certain, full of headaches for some traders. Still, we managed to pull out four consistently profitable trades for our members by sticking to our proven trading systems and deploying effective position sizing techniques. Not a bad week for us at all.
Today, we are writing this research post to highlight that price is still not “out of the woods” in terms of price structure and/or price rotation. Yes, there was quite a bit of external news that drove prices higher on Thursday and Friday (BREXIT, Earnings, and China decreasing the lending rates as well as decreasing bank asset levels in an effort to prompt more lending). These news items continue to drive price action and rotation. The VIX has settled at 15.00 as of Friday – the lowest level seen since early August 2019. Our opinion is that this is just a brief pause before more chaos hits the markets.
The BREXIT news was straight out of a suspense novel. At the very last minute, a coalition of political interests changed direction in an effort to stop the NO-DEAL BREXIT that seemed to be almost a sure thing. We don’t have any more information than what is printed in the news publications, but we believe the NO-DEAL BREXIT will happen this year.
Earnings were mixed with some interesting surprises. Jobs data came in relatively strong on Friday with higher earnings and higher working hours, yet job creation levels fell a bit from expected levels.
China seems to be relaxing its bank restrictions in an effort to jump-start their local economy. We read that current debt levels are 300% of GDP in China (and that only accounts for debt that is stated in official economic data). If one were to include the shadow banking system and corporate debt/bonds, we believe it could be as high as $425% of GDP or higher.
Then we have multiple countries in crisis (risk of bankruptcy) where the IMF is likely to try to develop some type of “bailout” solution. The most recent is Argentina. Additionally, the IMF has introduced new Cryptocurrency regulations that may stifle some emerging market ICO and existing Crypto operations as the IMF attempt to get a handle on these unregulated threats to traditional currency policies.
And we are just scratching the surface so far… What next – right?
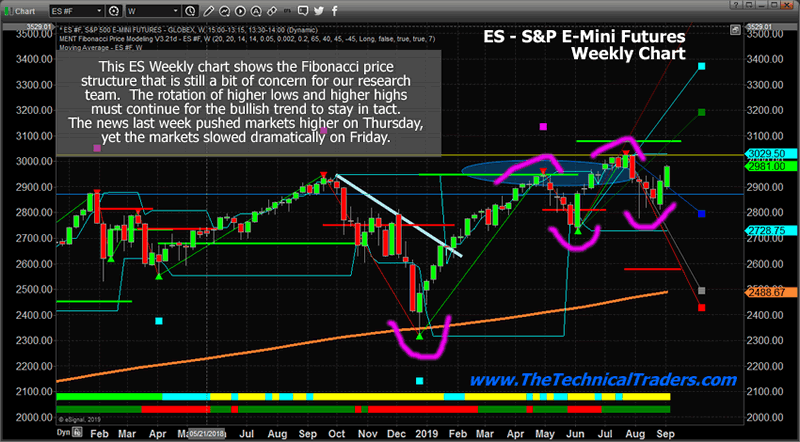
Well, here is a Weekly ES chart highlighting the Fibonacci price structure that appears to be, very much, in need of establishing fresh new highs in order to confirm this continued bullish trend. Right now, very similar to what happened in 2018, we are nearing an October date, near all-time highs, with fresh signs of weakness appearing throughout the global economy. Trade issues continue, people are talking about recessions and Gold and Silver have started an incredible upside move. Will the US stock market continue to rally from this point or rollover into a price correction?
It all depends on what happens over the next 2+ weeks and if the “capital shift” that we have continued to suggest is driving capital in the US stock market hasn’t broken rank yet. If foreign capital is continuing to pour into the US stock market for safety, then we may very well see another attempt at new all-time highs. If the recent weakness has spooked some investors out of the markets as Gold and Silver have caught their attention, then this capital shift may be much more muted at this time – meaning price volatility is much more of a concern.
SP500 Stock Index – Weekly Chart
The ES price will attempt to either move to new all-time highs or roll lower and take out the 2728 level. We believe the key to this future direction lies in which news items play out over the next 2+ weeks and if the price is able to return back to a “true price exploration” mode (without the news events).
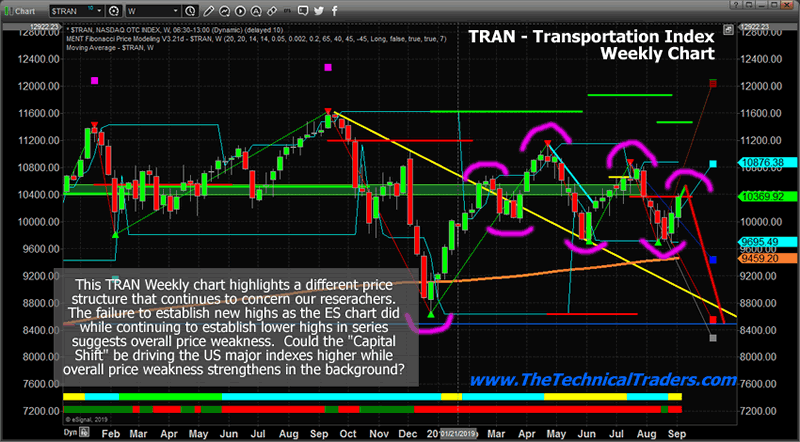
Weekly Transportation Sector Index Chart
This weekly TRAN, Transportation Index, highlights a broader picture of why our researchers are still concerned about a market correction. The fact that the price peaks have continued to move lower as a series of lower high price peaks is very concerning.
This is indicative of a downward price trend or a trend that is consolidating lower. The strength of support near 9695 is the only real strength we see in this TRAN chart in terms of “support for an upside move”. The TRAN chart price must break this downward series of lower price peaks in order for the US markets to really enter a new bullish price trend. Until that happens, we continue to stay worried that the foundation of the US markets may be crumbling below our feet while the party rages on in the US major indexes.
CONCLUDING THOUGHTS:
Our August 19th prediction of a breakdown event has obviously been invalidated by this recent upside price move. Depending on which way price breaks out of pattern will either validate or invalidate our expected forecast. As of right now, it looks like our August 19th prediction has been invalidated and we were wrong thinking it would break down. With that said, we had three winning trades we closed out last week for solid profits and a new high water-mark for our trading portfolio.
Although, until the US stock market rotates higher to establish new all-time highs, we are not out of the woods yet. This recent upside price move has not completely invalidated the chance of a breakdown because we have not already validated “new price highs” which are required in Fibonacci price theory. Right now, we are in the midst of volatile price rotation and we are loving every minute of it.
This is the type of price action that is perfect for skilled technical traders. Trade setups continue to pour into our systems. As we stated near the top of this article, we had a series of great trades this week resulting in nearly +15% total profits for our members. If you are a skilled technical trader, then this is the market for you to really shine.
Be prepared for these price swings before they happen and learn how you can identify and trade these fantastic trading opportunities in 2019, 2020, and beyond with our Wealth Building & Global Financial Reset Newsletter.
Join me with a 1 or 2-year subscription to lock in the lowest rate possible and ride my coattails as I navigate these financial market and build wealth while others lose nearly everything they own during the next financial crisis. Join Now and Get a 1oz Silver Round or Gold Bar Shipped To You Free.
I can tell you that huge moves are about to start unfolding not only in currencies, metals, or stocks but globally and some of these supercycles are going to last years. A gentleman by the name of Brad Matheny goes into great detail with his simple to understand charts and guide about this. His financial market research is one of a kind and a real eye-opener. 2020 Cycles – The Greatest Opportunity Of Your Lifetime
As a technical analysis and trader since 1997, I have been through a few bull/bear market cycles. I believe I have a good pulse on the market and timing key turning points for both short-term swing trading and long-term investment capital. The opportunities are massive/life-changing if handled properly.
FREE GOLD OR SILVER WITH SUBSCRIPTION!
Chris Vermeulen
www.TheTechnicalTraders.com
Chris Vermeulen has been involved in the markets since 1997 and is the founder of Technical Traders Ltd. He is an internationally recognized technical analyst, trader, and is the author of the book: 7 Steps to Win With Logic
Through years of research, trading and helping individual traders around the world. He learned that many traders have great trading ideas, but they lack one thing, they struggle to execute trades in a systematic way for consistent results. Chris helps educate traders with a three-hour video course that can change your trading results for the better.
His mission is to help his clients boost their trading performance while reducing market exposure and portfolio volatility.
He is a regular speaker on HoweStreet.com, and the FinancialSurvivorNetwork radio shows. Chris was also featured on the cover of AmalgaTrader Magazine, and contributes articles to several leading financial hubs like MarketOracle.co.uk
Disclaimer: Nothing in this report should be construed as a solicitation to buy or sell any securities mentioned. Technical Traders Ltd., its owners and the author of this report are not registered broker-dealers or financial advisors. Before investing in any securities, you should consult with your financial advisor and a registered broker-dealer. Never make an investment based solely on what you read in an online or printed report, including this report, especially if the investment involves a small, thinly-traded company that isn’t well known. Technical Traders Ltd. and the author of this report has been paid by Cardiff Energy Corp. In addition, the author owns shares of Cardiff Energy Corp. and would also benefit from volume and price appreciation of its stock. The information provided here within should not be construed as a financial analysis but rather as an advertisement. The author’s views and opinions regarding the companies featured in reports are his own views and are based on information that he has researched independently and has received, which the author assumes to be reliable. Technical Traders Ltd. and the author of this report do not guarantee the accuracy, completeness, or usefulness of any content of this report, nor its fitness for any particular purpose. Lastly, the author does not guarantee that any of the companies mentioned in the reports will perform as expected, and any comparisons made to other companies may not be valid or come into effect.
Chris Vermeulen Archive |
© 2005-2022 http://www.MarketOracle.co.uk - The Market Oracle is a FREE Daily Financial Markets Analysis & Forecasting online publication.