


Revisiting “Black Monday Stock Market Crash October 19 1987
Stock-Markets / Stock Market Crash Oct 21, 2019 - 12:00 PM GMTBy: Chris_Vermeulen

 Back in the day, for those of you that are old enough to remember and have experienced one of the most incredible trader psychology driven stock market decline in recent history.
The difference between “Black Monday” and most of the other recent stock market declines is that October 19, 1987, was driven by a true psychological panic, what we consider true price exploration, after an incredible price rally.
It is different than the DOT COM (2001) decline and vastly different than the Credit Market Crisis (2008-09) because both of those events were related to true fundamental and technical evaluations. In both of those instances, prices have been rising for quite some time, but the underlying fundamentals of the economics of the markets collapsed and the markets collapsed with future expectations. Before we get too deep, be sure to opt-in to our free market trend signals newsletter.
Our researchers believe the setup prior to the Black Monday collapse is strangely similar to the current setup across the global markets. In 1982, Ronald Reagan was elected into his second term as the US President. Since his election in 1980, the US stock market has risen over 300% by August 1987.
Reagan, much like President Trump, was elected after a long period of US economic malaise and ushered in an economic boom-cycle that really began to accelerate near August 1983 – near the end of his first term. The expansion from the lows of 1982, near 102.20, to the highs of 1987, near 337.90, in the S&P 500 prompted an incredible rally in the US markets for all global investors.
This is very similar to what has happened since 2015/16 in the markets and particularly after the November 2016 elections when the S&P500 bottomed near 1807.5 and has recently set hew highs near 3026.20 – a 67.4% price rally in just over 3 years.
One can simply make the assumption that global investors poured capital in the US markets in 1983 to 1986 as the US markets entered a rally mode just like we suspect global investors have poured capital into the US markets after the 2016 US elections and have continued to seek value, safety, and returns in the US markets since. These incredible price rallies setup a very real potential for “true price exploration” when investors suddenly realize valuations may be out of control.
So, what actually happened on October 19th, 1987 that was different than the last few market collapse events and why is it so similar to what is happening today?
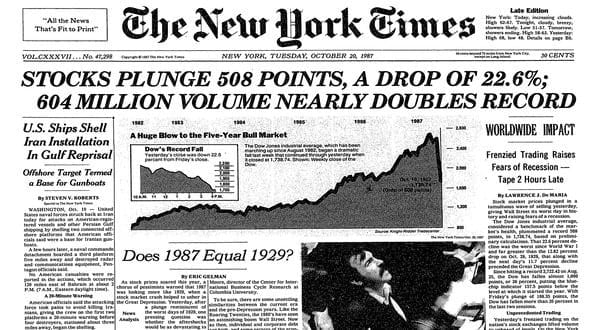
On October 19, 1987, a different set of circumstances took place. This was almost a perfect storm of sorts for the markets. The US markets had risen nearly 44% by August 1987 from the previous yearly close – a huge rally had taken place. Computer trading, which some people suspected may have been a reason for the price decline on October 19, was largely in its infancy.
Floor traders were running the show in New York and Chicago. The London markets closed early the Friday, October 16, because of a weather event that was taking place. The “setup” of these events may have played a roll in the liquidity issues that became evident on Black Monday and pushed the US markets down 22.61% by the end of trading.
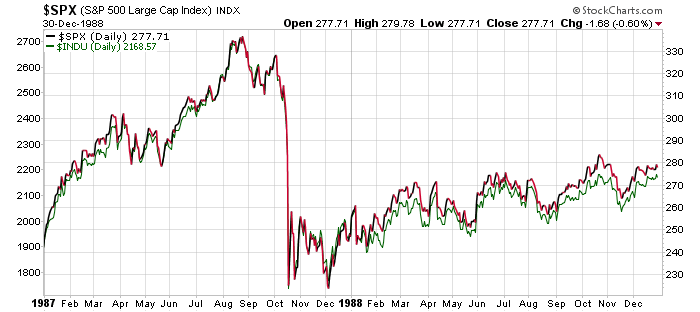
The US markets had set up a top near 2,722 in early August 1987 after rising nearly 44% from the 1986 end of year closing price level of 1,895. The SPX rotated lower from this peak to set up a sideways price channel near 315 throughout the end of August and through most of September. On October 5, 1987, the SPX started a downward price move that attempted to test the lower support channel near 312. On October 12, one week later, the SPX broke below this support channel and closed at 298.10 (below the psychological 300 level). The very next weekend was October 17 & 18 – the weekend before Black Monday.
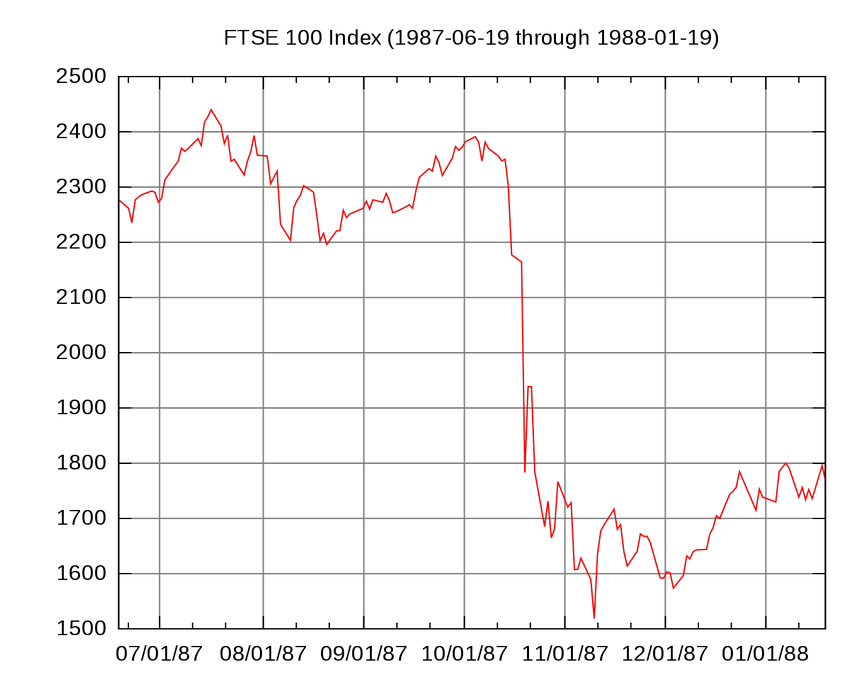
Sunday night, October 18, in the US, the Asian markets opened for trading and a price sell-off began taking place in Hong Kong. Because the London markets has closed early on the 16th due to the storm, by the time they opened the UK markets began tanking almost immediately. Early in the day on Monday, October 19, the FTSE100 had collapsed over 136 points.
Our researchers believe the declines in the US markets in early October 1987 set up a breakdown event that, once support was broken, prompted a collapse event where liquidity issues accelerated the price decline volatility – much like the “flash crash”. Global investors were unprepared for the scale and scope of the price decline event and panicked at the speed of the price collapse.
In fact, at the height of the 1987 crash, systemic problems (mostly solvency and brokerage house operations) continued to threaten a much larger financial market collapse. Within days of Black Monday, it became evident that margin accounts and solvency issues related to operating capital, large scale risks and continued fear that the markets may continue to collapse presented a very real problem for the US and for the world. Have we reentered another Black Monday type of setup across the global markets?
As new economic data continues to suggest the global markets are economically contracting and stagnating, the US Federal Reserve has started buying assets again while the foreign central banks continue to push negative interest rates while attempting to spark any signs of real economic growth. The US stock market has continued to push higher – almost attempting new all-time highs again just recently. The US stock market is up nearly 68% over the past 3.5 years since Trump was elected and as of Friday, October 18, 2019, the US stock markets fell nearly 0.75% on economic fears.
In Part II of this article, we’ll explore the potential of another Black Monday type of setup that may be playing out before our very eyes right now in the US stock market.
As a technical analysis and trader since 1997, I have been through a few bull/bear market cycles. I believe I have a good pulse on the market and timing key turning points for both short-term swing trading and long-term investment capital. The opportunities are massive/life-changing if handled properly.
I urge you visit my ETF Wealth Building Newsletter and if you like what I offer, join me with the 1-year subscription to lock in the lowest rate possible and ride my coattails as I navigate these financial market and build wealth while others lose nearly everything they own during the next financial crisis. Join Today to Get a Free 1oz Silver Bar with a subscription – Offer Ends This Week!
Chris Vermeulen
www.TheTechnicalTraders.com
Chris Vermeulen has been involved in the markets since 1997 and is the founder of Technical Traders Ltd. He is an internationally recognized technical analyst, trader, and is the author of the book: 7 Steps to Win With Logic
Through years of research, trading and helping individual traders around the world. He learned that many traders have great trading ideas, but they lack one thing, they struggle to execute trades in a systematic way for consistent results. Chris helps educate traders with a three-hour video course that can change your trading results for the better.
His mission is to help his clients boost their trading performance while reducing market exposure and portfolio volatility.
He is a regular speaker on HoweStreet.com, and the FinancialSurvivorNetwork radio shows. Chris was also featured on the cover of AmalgaTrader Magazine, and contributes articles to several leading financial hubs like MarketOracle.co.uk
Disclaimer: Nothing in this report should be construed as a solicitation to buy or sell any securities mentioned. Technical Traders Ltd., its owners and the author of this report are not registered broker-dealers or financial advisors. Before investing in any securities, you should consult with your financial advisor and a registered broker-dealer. Never make an investment based solely on what you read in an online or printed report, including this report, especially if the investment involves a small, thinly-traded company that isn’t well known. Technical Traders Ltd. and the author of this report has been paid by Cardiff Energy Corp. In addition, the author owns shares of Cardiff Energy Corp. and would also benefit from volume and price appreciation of its stock. The information provided here within should not be construed as a financial analysis but rather as an advertisement. The author’s views and opinions regarding the companies featured in reports are his own views and are based on information that he has researched independently and has received, which the author assumes to be reliable. Technical Traders Ltd. and the author of this report do not guarantee the accuracy, completeness, or usefulness of any content of this report, nor its fitness for any particular purpose. Lastly, the author does not guarantee that any of the companies mentioned in the reports will perform as expected, and any comparisons made to other companies may not be valid or come into effect.
Chris Vermeulen Archive |
© 2005-2022 http://www.MarketOracle.co.uk - The Market Oracle is a FREE Daily Financial Markets Analysis & Forecasting online publication.