


Stock Market Crash Setup?
Stock-Markets / Stock Market Crash Oct 21, 2019 - 12:27 PM GMTBy: Chris_Vermeulen

 Our research team has been attempting to answer the question that seems to be on everyone’s minds right now – are we setting up another Black Monday type of event in the global markets and what should traders/investors know before the event potentially takes place. Our research team has spent the past few weeks trying to better understand the global economic events that took place 8 to 20+ years before the Black Monday event happened and have been particularly interested in the 10+ years just before the Black Monday event. Additionally, we’ll focus on the recovery event that took place after the Black Monday collapse completed.
In Part I of this article, we attempted to highlight some of the similarities of today’s global economic world to the scenario in the early 1980s. Many of you may not be old enough to remember the 1960s or 1970s, but at least one individual on our research team is old enough and was actively trading in 1985. His interpretation of the economic events prior to the 1987 Black Monday collapse and how they may be similar to today highlight some very interesting facets for our readers.
The late 1970s was a period where most Americans worked hard, tried to play by the rules and struggled to attempt to get ahead in a world that seemed to be a little out of order. The 1960s was a period of awakening in America where music, culture, and people shifted away from the WWII era and post-WWII era thinking. Vietnam, Korea and a host of other issues, as well as rising US interest rates, presented very real problems for many Americans. By the time the US entered the 1980s, Americans had already experienced the assassination of John F. Kennedy, the race to the moon, multiple wars, victories and defeats, a cultural shift to near the extremes and another shift moving our culture back closer to center, Oil/energy crisis events, a moderate malaise of economic prosperity, and continually higher US interest rates. Then the US elected Ronald Reagan.
It seemed to everyone that Ronald Reagan had unlocked secrets to the American opportunity that had been somewhat lost over the previous few decades. In reality, the first 2 to 3 years of the Reagan Presidency resulted in very mixed economic results – almost identical to President Carter’s. The biggest identifying factor that our research team found was that the US Federal Reserve altered its rate policy in the early Reagan years from a “raising stance” to a “declining stance”. Throughout Carter’s term, the FFR rate change averaged +2.08. Throughout the first four years under Reagan’s term, the FFR rate change averaged -0.7825. By 1984, the US Federal Reserve had lowered rates, twice, by an average of over 7% after raising rates every year since 1977.
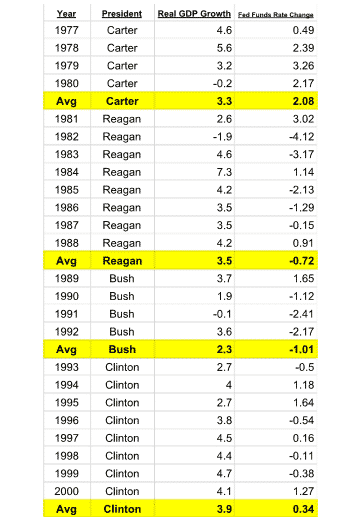
(source: https://einvestingforbeginners.com/us-gdp-growth-history/)
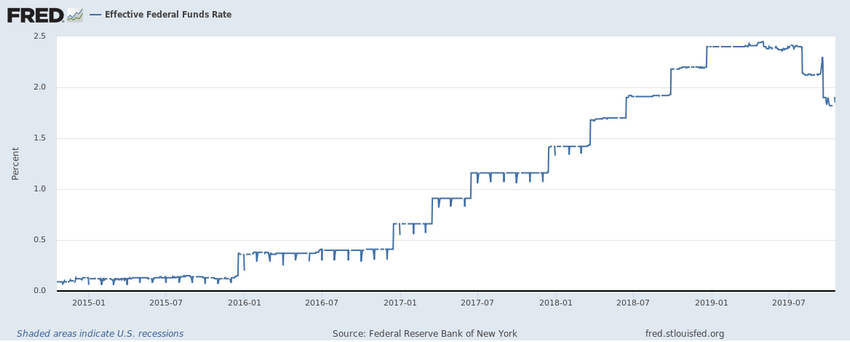
Is this similar to what is happening today? The US Federal Reserve began raising rates in December 2015 and continued to raise rates until August 2019 – nearly 3.7 years of rate increases after nearly a decade of near-zero interest rates prior to 2016.
Another interesting facet is what our research team calls the “capital shift” that has taken place since just before 2015 – where foreign capital has poured into the US stock market and asset markets for safety, security, and returns. Prior to the point where capital controls were instigated in China (in 2015), a moderate capital shift event was already taking place. Once China installed these new capital controls, attempting to prevent capital from fleeing their local economy, a broader shift took place where the US markets began to rally and where foreign capital was more actively attracted to the US stock/asset markets because of the strength of the US Dollar and the continued rally in the US stock market. This is similar to what happened in 1983 through 1987.
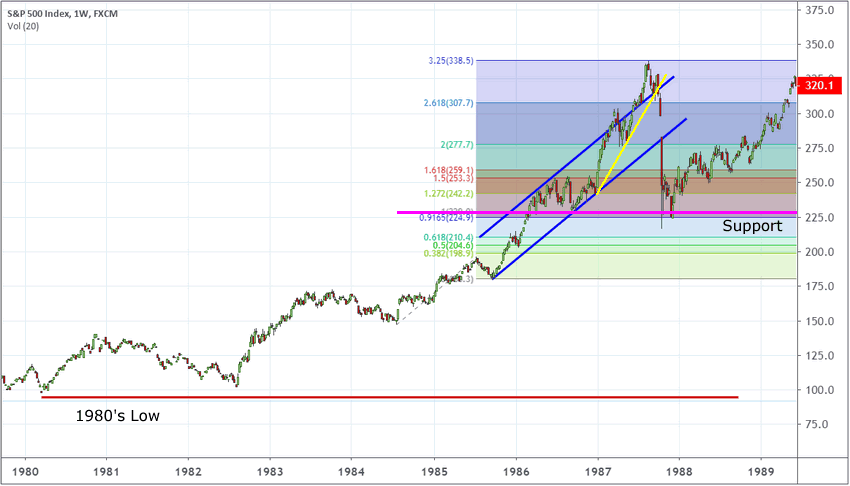
These comparison charts of the 1980s and the current 8+ years of the S&P 500 charts highlight some very interesting facets of both peaks.
_ Support set up nearly 24 months prior to the collapse in 1987. This support channel became the ultimate price channel level to break as Black Monday hit.
_ Price was able to rally above the upper price channel three times before the breakdown event began. This upper price channel mirrors the lower price channel slope and is anchored near the tops after the initial support bottom is setup.
_ The final rally attempt before Black Monday initiated near early January 1987 – nearly 9 months before the peak and 10 months before the price breakdown began.
Within the current S&P 500 chart, some slight variations are present.
_ Support set up nearly 44 months prior to the peak in 2019. This support channel is the ultimate price channel level that acts as ultimate support for the price trend.
_ Price has been able to rally above the upper price channel four times since the ultimate support level was set up in 2016
_ The most recent rally attempt initiated near early January 2019 and has lasted nearly 9 months before the current peak. As of today, we are nearly a full 10 months into this new price rally.
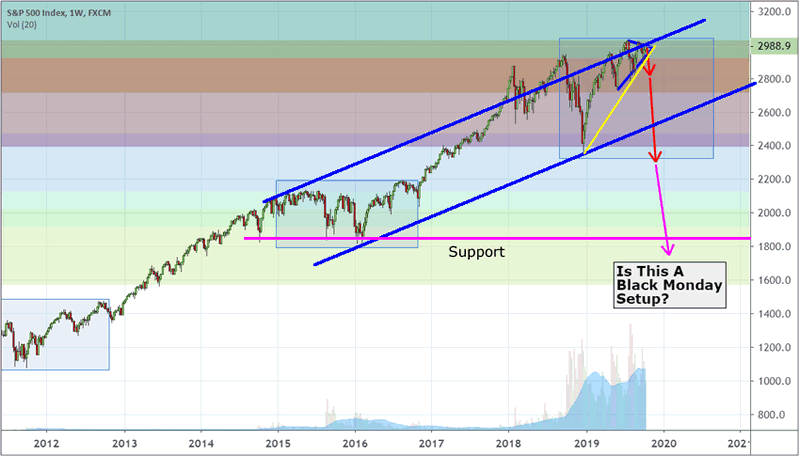
Although there are subtle differences in the price setup, rotation, and trend lengths, we can certainly see a similarity in between these two chart and we believe the recent price advance in the US stock market, along with the fact that capital has continued to pour into the US markets over the past 3+ years, sets up a similar type of event where current price levels, valuation, and risks may have been under-weighted dramatically.
Could another Black Monday type of event happen in today’s global markets? Certainly, it could. All it would take is for global traders/investors to suddenly realize there is a new degree of risk or excessive price valuation that currently exists in the markets and to begin liquidating assets in a mass event.
What would it take for something like this to happen? Quite possibly, China or Hong Kong could, again, present a very real risk for the global markets if a threat to the lower price support channel becomes threatened. A collapse in true value would relate as a potential “true price exploration” event (a reversion event) where global traders may attempt to retest substantial historical support.
Our belief is that true historical support currently resides near 1860 on the S&P 500 – which aligns with the same type of price reversion that occurred in 1987.
Time will tell if we are currently set up for another Black Monday event. In fact, we may know as early as Monday, October, 21. Until the lower support channel is seriously threatened by any new downside price move, the chances of this type of event happening are fairly low. As you are well aware.. things can change very quickly. Pay attention to near originating out of Hong Kong, China or Asia over the weekends as any type of real risk could spill over into the UK and US markets very early on Mondays.
As a technical analysis and trader since 1997, I have been through a few bull/bear market cycles. I believe I have a good pulse on the market and timing key turning points for both short-term swing trading and long-term investment capital. The opportunities are massive/life-changing if handled properly.
I urge you visit my ETF Wealth Building Newsletter and if you like what I offer, join me with the 1-year subscription to lock in the lowest rate possible and ride my coattails as I navigate these financial market and build wealth while others lose nearly everything they own during the next financial crisis. Join Today to Get a Free 1oz Silver Bar with a subscription – Offer Ends This Week!
Chris Vermeulen
www.TheTechnicalTraders.com
Chris Vermeulen has been involved in the markets since 1997 and is the founder of Technical Traders Ltd. He is an internationally recognized technical analyst, trader, and is the author of the book: 7 Steps to Win With Logic
Through years of research, trading and helping individual traders around the world. He learned that many traders have great trading ideas, but they lack one thing, they struggle to execute trades in a systematic way for consistent results. Chris helps educate traders with a three-hour video course that can change your trading results for the better.
His mission is to help his clients boost their trading performance while reducing market exposure and portfolio volatility.
He is a regular speaker on HoweStreet.com, and the FinancialSurvivorNetwork radio shows. Chris was also featured on the cover of AmalgaTrader Magazine, and contributes articles to several leading financial hubs like MarketOracle.co.uk
Disclaimer: Nothing in this report should be construed as a solicitation to buy or sell any securities mentioned. Technical Traders Ltd., its owners and the author of this report are not registered broker-dealers or financial advisors. Before investing in any securities, you should consult with your financial advisor and a registered broker-dealer. Never make an investment based solely on what you read in an online or printed report, including this report, especially if the investment involves a small, thinly-traded company that isn’t well known. Technical Traders Ltd. and the author of this report has been paid by Cardiff Energy Corp. In addition, the author owns shares of Cardiff Energy Corp. and would also benefit from volume and price appreciation of its stock. The information provided here within should not be construed as a financial analysis but rather as an advertisement. The author’s views and opinions regarding the companies featured in reports are his own views and are based on information that he has researched independently and has received, which the author assumes to be reliable. Technical Traders Ltd. and the author of this report do not guarantee the accuracy, completeness, or usefulness of any content of this report, nor its fitness for any particular purpose. Lastly, the author does not guarantee that any of the companies mentioned in the reports will perform as expected, and any comparisons made to other companies may not be valid or come into effect.
Chris Vermeulen Archive |
© 2005-2022 http://www.MarketOracle.co.uk - The Market Oracle is a FREE Daily Financial Markets Analysis & Forecasting online publication.